


Achievable logoAchievable logo
CMA Part 1
Sign in
Sign up
Purchase
Textbook
Practice exams
Support
How it works
Exam catalog
Mountain with a flag at the peak
Textbook
1. External financial reporting decisions
2. Planning, budgeting, and forecasting
3. Performance management
3.1 Cost and variance measures
3.1.1 Comparison of actual to planned results
3.1.2 Calculating and interpreting variances
3.1.3 Flexible budgets
3.1.4 Management by exception and standard cost systems
3.2 Responsibility centers and reporting segments
3.3 Performance measures
4. Cost management
5. Internal control
6. Technology and analytics
Achievable logoAchievable logo
3.1.2 Calculating and interpreting variances
Achievable CMA Part 1
3. Performance management
3.1. Cost and variance measures
Our CMA Part 1 course is currently in development and is a work-in-progress.

Calculating and interpreting variances

8 min read
Font
Discuss
Share
Feedback

Calculating and interpreting variances

The master budget, which serves as the benchmark for evaluating performance, is a static budget. A static budget is based on projected revenues and costs for a single level of activity and does not change, even if actual activity levels differ. This fixed nature of the master budget provides a high-level view of planned versus actual results but does not account for variances caused by changes in volume or other factors.

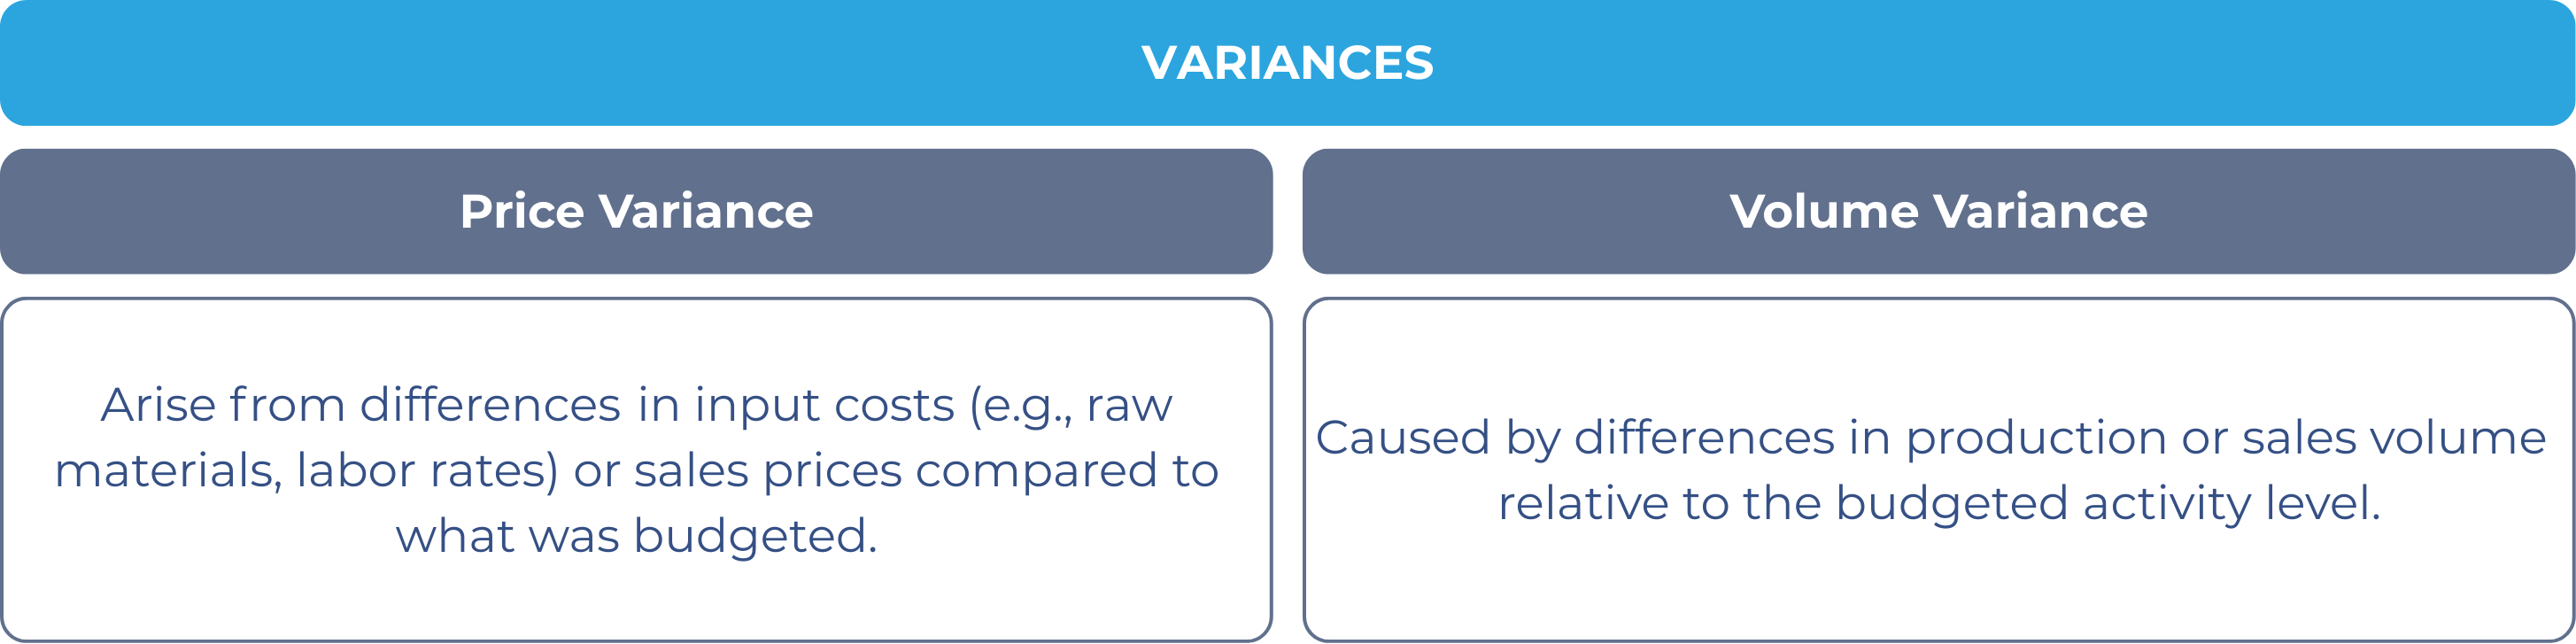
The total variance between actual results and the master budget provides a summary of performance, indicating whether the organization’s overall performance was favorable or unfavorable. However, understanding why the variances occurred requires further analysis, such as breaking them down into price and volume variances, or examining other contributing factors.

General breakdown of variances

By analyzing these components, managers can move beyond identifying total variances to understanding their underlying causes, which supports more effective decision-making.

The example below shows a comparison between the master budget and actual results in terms of the main line items in an income statement. The final column shows the type of the variance and the general interpretations are further discussed in the succeeding paragraph.

Category Budgeted
(Master budget)
Actual results Variance
(Actual results less
Master budget)
Type
Revenue $500,000 $520,000 $20,000 Favorable
Direct materials ($150,000) ($160,000) ($10,000) Unfavorable
Direct labor ($100,000) ($95,000) $5,000 Favorable
Overhead ($50,000) ($55,000) ($5,000) Unfavorable
Net profit $200,000 $210,000 $10,000 Favorable

The interpretations below focus on the total variance since we did not yet introduce how to break down the total into price and volume variances.

Revenue variance ($20,000 Favorable)

The favorable variance in revenue suggests that actual sales exceeded expectations. However, at this stage, we do not know if this was due to higher selling prices, greater sales volume, or a favorable product mix. Further analysis would be needed to determine the specific drivers.

Direct materials variance ($10,000 Unfavorable)

The unfavorable variance for direct materials indicates that costs for direct materials used in production exceeded the budget. This could be caused by higher input prices, inefficiencies leading to increased material usage, or a combination of both. Additional investigation into material purchase records and usage rates would provide clarity.

Direct labor variance ($5,000 Favorable)

The favorable variance in direct labor reflects lower-than-budgeted labor costs. This might result from lower wage rates, reduced labor hours, or improved efficiency. However, without more detailed data, it is unclear whether this variance is entirely favorable or if it masks other issues such as insufficient staffing or overtime costs avoided by underproduction.

Overhead variance ($5,000 Unfavorable)

The unfavorable variance in overhead suggests higher costs for items such as utilities, rent, or indirect labor. Further analysis would reveal whether this variance arose from fixed cost overruns, variable cost increases due to higher activity levels, or inefficiencies in resource utilization.

Net profit variance ($10,000 Favorable)

The overall favorable variance in net profit reflects a combination of the above factors. While the net result is positive, detailed analysis is necessary to determine if the underlying variances signal operational strengths or areas for concern.

This high-level variance analysis illustrates the importance of breaking down total variances into their components. The initial variance results from comparing actual outcomes to the static master budget, which assumes a single activity level. However, variances often arise from multiple interrelated factors, such as prices, volumes, or operational efficiencies, that may require further exploration.

In later sections, we will expand on this framework by introducing techniques for dissecting price and volume variances, as well as analyzing the impact of other factors. These tools will help managers pinpoint the root causes of variances and take targeted corrective actions to align actual performance with strategic goals.

The comparison of actual results to the master budget is a fundamental aspect of performance management. While this approach provides valuable insights into organizational performance, it also has inherent limitations. A balanced understanding of its benefits and drawbacks helps organizations optimize its use alongside other analytical tools.

Benefits of comparing actual to master budget

The following are some of the benefits of the variance analysis by comparing actual results to the master budget:

1. Accountability

Comparing actual results to the master budget holds individuals and departments accountable for meeting financial and operational goals. Responsibility centers, such as cost centers, profit centers, and investment centers, are evaluated based on their ability to achieve planned targets. This fosters a culture of accountability, motivating managers and employees to align their actions with organizational objectives.

2. Operational insights

Variance analysis highlights areas of strength and weakness in operational performance. Favorable variances can point to areas where strategies have been particularly effective, such as a successful marketing campaign driving higher-than-expected sales. Conversely, unfavorable variances signal areas needing improvement, such as inefficiencies in material usage or labor productivity. These insights enable organizations to focus their resources on addressing weaknesses while reinforcing strengths.

3. Data-driven decisions

The master budget provides a quantitative framework for evaluating performance, offering a clear baseline against which actual results can be measured. Variances provide objective data that guide corrective actions, such as adjusting procurement strategies in response to rising input costs or revising sales forecasts based on actual market conditions. By leveraging these insights, managers can make informed decisions that improve overall efficiency and effectiveness.

Limitations of comparing actual to master budget

The following are some of the limitations of the variance analysis by comparing actual results to the master budget:

1. Static nature of master budgets

Master budgets are static, meaning they are based on a single set of assumptions about activity levels, costs, and revenues. This fixed nature limits their adaptability to changes in the business environment, such as unexpected fluctuations in demand or supply chain disruptions. For example, if actual production volume deviates significantly from the budgeted volume, the variances may not accurately reflect performance because the master budget does not account for these changes.

To address this limitation, organizations often complement master budgets with flexible budgets, which adjust for changes in activity levels and provide a more accurate basis for evaluating performance.

2. Inflexibility for dynamic analysis

Variances calculated against the master budget are summarized at a high level, which can obscure more specific performance drivers. For instance, a favorable variance in total revenue may mask unfavorable variances in certain product lines or geographic regions. Without breaking down the variances into their components (e.g., price, volume, and product mix), managers may miss critical insights that could guide more targeted actions.

Advanced variance analysis techniques, such as price-volume variance breakdowns and contribution margin analysis, help organizations uncover the underlying factors contributing to variances.

3. Focus on short-term results

The comparison between actual results and the master budget tends to emphasize immediate performance outcomes, such as monthly or quarterly results. While this focus is useful for day-to-day management, it may detract from long-term strategic goals. For example, a department may delay necessary investments or avoid short-term expenses to meet budgeted targets, potentially compromising long-term growth or operational efficiency.

Organizations can balance short-term performance monitoring with long-term strategic planning by integrating variance analysis with broader performance management tools, such as balanced scorecards or key performance indicators (KPIs).

Conclusion

Comparing actual results to the master budget is a critical starting point in performance management. By providing a high-level overview of variances, it highlights areas where performance aligns with or deviates from organizational goals. This process fosters accountability, offers operational insights, and supports data-driven decision-making. However, the static nature of the master budget limits its adaptability to changing business conditions, and high-level variance analysis may obscure the specific drivers of performance.

To address these limitations, organizations should view the master budget as a foundational tool complemented by deeper variance analyses, such as price and volume breakdowns, as well as flexible budgeting techniques. Understanding the common causes of variances provides a framework for interpreting results and identifying actionable opportunities for improvement.

Ultimately, this chapter emphasizes the importance of critical thinking in variance analysis. Rather than simply categorizing variances as favorable or unfavorable, managers are encouraged to investigate the underlying causes and their implications. This approach sets the stage for advanced analytical techniques, discussed in subsequent sections, that enable more dynamic and strategic performance evaluations.(change me)

Calculating and interpreting variances

  • Master budget is a static, single-activity-level benchmark
  • Total variance = actual results minus master budget; indicates overall performance (favorable/unfavorable)
  • Deeper analysis needed: break down total variance into price, volume, and other factors for actionable insights

Interpreting income statement variances

  • Revenue variance: favorable if actual sales > budget; cause may be price, volume, or mix (needs further analysis)
  • Direct materials variance: unfavorable if actual costs > budget; may result from higher prices or inefficiency
  • Direct labor variance: favorable if actual labor costs < budget; could be due to lower wages, fewer hours, or higher efficiency
  • Overhead variance: unfavorable if actual overhead > budget; may be due to fixed or variable cost overruns
  • Net profit variance: overall result of above; requires analysis to determine underlying strengths or concerns

Benefits of comparing actual to master budget

  • Promotes accountability for meeting financial/operational goals
  • Provides operational insights into strengths and weaknesses
  • Enables data-driven decisions using objective variance data

Limitations of comparing actual to master budget

  • Static master budget does not adapt to changing activity levels or business conditions
    • Flexible budgets can address this limitation
  • High-level variances may obscure specific performance drivers
    • Advanced techniques (e.g., price-volume breakdowns) needed for deeper insight
  • Focuses on short-term results, potentially at the expense of long-term strategy
    • Should be balanced with broader performance management tools

Conclusion

  • Master budget variance analysis is foundational for performance management
  • Must be complemented by deeper variance analysis and flexible budgeting
  • Critical thinking and investigation of underlying causes are essential for effective decision-making

Sign up for free to take 10 quiz questions on this topic

Previous
Next  | 3.1.3.1 Learning outcome statements
All rights reserved ©2016 - 2026 Achievable, Inc.

Calculating and interpreting variances

Calculating and interpreting variances

The master budget, which serves as the benchmark for evaluating performance, is a static budget. A static budget is based on projected revenues and costs for a single level of activity and does not change, even if actual activity levels differ. This fixed nature of the master budget provides a high-level view of planned versus actual results but does not account for variances caused by changes in volume or other factors.

The total variance between actual results and the master budget provides a summary of performance, indicating whether the organization’s overall performance was favorable or unfavorable. However, understanding why the variances occurred requires further analysis, such as breaking them down into price and volume variances, or examining other contributing factors.

By analyzing these components, managers can move beyond identifying total variances to understanding their underlying causes, which supports more effective decision-making.

The example below shows a comparison between the master budget and actual results in terms of the main line items in an income statement. The final column shows the type of the variance and the general interpretations are further discussed in the succeeding paragraph.

Category Budgeted
(Master budget)
Actual results Variance
(Actual results less
Master budget)
Type
Revenue $500,000 $520,000 $20,000 Favorable
Direct materials ($150,000) ($160,000) ($10,000) Unfavorable
Direct labor ($100,000) ($95,000) $5,000 Favorable
Overhead ($50,000) ($55,000) ($5,000) Unfavorable
Net profit $200,000 $210,000 $10,000 Favorable

The interpretations below focus on the total variance since we did not yet introduce how to break down the total into price and volume variances.

Revenue variance ($20,000 Favorable)

The favorable variance in revenue suggests that actual sales exceeded expectations. However, at this stage, we do not know if this was due to higher selling prices, greater sales volume, or a favorable product mix. Further analysis would be needed to determine the specific drivers.

Direct materials variance ($10,000 Unfavorable)

The unfavorable variance for direct materials indicates that costs for direct materials used in production exceeded the budget. This could be caused by higher input prices, inefficiencies leading to increased material usage, or a combination of both. Additional investigation into material purchase records and usage rates would provide clarity.

Direct labor variance ($5,000 Favorable)

The favorable variance in direct labor reflects lower-than-budgeted labor costs. This might result from lower wage rates, reduced labor hours, or improved efficiency. However, without more detailed data, it is unclear whether this variance is entirely favorable or if it masks other issues such as insufficient staffing or overtime costs avoided by underproduction.

Overhead variance ($5,000 Unfavorable)

The unfavorable variance in overhead suggests higher costs for items such as utilities, rent, or indirect labor. Further analysis would reveal whether this variance arose from fixed cost overruns, variable cost increases due to higher activity levels, or inefficiencies in resource utilization.

Net profit variance ($10,000 Favorable)

The overall favorable variance in net profit reflects a combination of the above factors. While the net result is positive, detailed analysis is necessary to determine if the underlying variances signal operational strengths or areas for concern.

This high-level variance analysis illustrates the importance of breaking down total variances into their components. The initial variance results from comparing actual outcomes to the static master budget, which assumes a single activity level. However, variances often arise from multiple interrelated factors, such as prices, volumes, or operational efficiencies, that may require further exploration.

In later sections, we will expand on this framework by introducing techniques for dissecting price and volume variances, as well as analyzing the impact of other factors. These tools will help managers pinpoint the root causes of variances and take targeted corrective actions to align actual performance with strategic goals.

The comparison of actual results to the master budget is a fundamental aspect of performance management. While this approach provides valuable insights into organizational performance, it also has inherent limitations. A balanced understanding of its benefits and drawbacks helps organizations optimize its use alongside other analytical tools.

Benefits of comparing actual to master budget

The following are some of the benefits of the variance analysis by comparing actual results to the master budget:

1. Accountability

Comparing actual results to the master budget holds individuals and departments accountable for meeting financial and operational goals. Responsibility centers, such as cost centers, profit centers, and investment centers, are evaluated based on their ability to achieve planned targets. This fosters a culture of accountability, motivating managers and employees to align their actions with organizational objectives.

2. Operational insights

Variance analysis highlights areas of strength and weakness in operational performance. Favorable variances can point to areas where strategies have been particularly effective, such as a successful marketing campaign driving higher-than-expected sales. Conversely, unfavorable variances signal areas needing improvement, such as inefficiencies in material usage or labor productivity. These insights enable organizations to focus their resources on addressing weaknesses while reinforcing strengths.

3. Data-driven decisions

The master budget provides a quantitative framework for evaluating performance, offering a clear baseline against which actual results can be measured. Variances provide objective data that guide corrective actions, such as adjusting procurement strategies in response to rising input costs or revising sales forecasts based on actual market conditions. By leveraging these insights, managers can make informed decisions that improve overall efficiency and effectiveness.

Limitations of comparing actual to master budget

The following are some of the limitations of the variance analysis by comparing actual results to the master budget:

1. Static nature of master budgets

Master budgets are static, meaning they are based on a single set of assumptions about activity levels, costs, and revenues. This fixed nature limits their adaptability to changes in the business environment, such as unexpected fluctuations in demand or supply chain disruptions. For example, if actual production volume deviates significantly from the budgeted volume, the variances may not accurately reflect performance because the master budget does not account for these changes.

To address this limitation, organizations often complement master budgets with flexible budgets, which adjust for changes in activity levels and provide a more accurate basis for evaluating performance.

2. Inflexibility for dynamic analysis

Variances calculated against the master budget are summarized at a high level, which can obscure more specific performance drivers. For instance, a favorable variance in total revenue may mask unfavorable variances in certain product lines or geographic regions. Without breaking down the variances into their components (e.g., price, volume, and product mix), managers may miss critical insights that could guide more targeted actions.

Advanced variance analysis techniques, such as price-volume variance breakdowns and contribution margin analysis, help organizations uncover the underlying factors contributing to variances.

3. Focus on short-term results

The comparison between actual results and the master budget tends to emphasize immediate performance outcomes, such as monthly or quarterly results. While this focus is useful for day-to-day management, it may detract from long-term strategic goals. For example, a department may delay necessary investments or avoid short-term expenses to meet budgeted targets, potentially compromising long-term growth or operational efficiency.

Organizations can balance short-term performance monitoring with long-term strategic planning by integrating variance analysis with broader performance management tools, such as balanced scorecards or key performance indicators (KPIs).

Conclusion

Comparing actual results to the master budget is a critical starting point in performance management. By providing a high-level overview of variances, it highlights areas where performance aligns with or deviates from organizational goals. This process fosters accountability, offers operational insights, and supports data-driven decision-making. However, the static nature of the master budget limits its adaptability to changing business conditions, and high-level variance analysis may obscure the specific drivers of performance.

To address these limitations, organizations should view the master budget as a foundational tool complemented by deeper variance analyses, such as price and volume breakdowns, as well as flexible budgeting techniques. Understanding the common causes of variances provides a framework for interpreting results and identifying actionable opportunities for improvement.

Ultimately, this chapter emphasizes the importance of critical thinking in variance analysis. Rather than simply categorizing variances as favorable or unfavorable, managers are encouraged to investigate the underlying causes and their implications. This approach sets the stage for advanced analytical techniques, discussed in subsequent sections, that enable more dynamic and strategic performance evaluations.(change me)

Key points

Calculating and interpreting variances

  • Master budget is a static, single-activity-level benchmark
  • Total variance = actual results minus master budget; indicates overall performance (favorable/unfavorable)
  • Deeper analysis needed: break down total variance into price, volume, and other factors for actionable insights

Interpreting income statement variances

  • Revenue variance: favorable if actual sales > budget; cause may be price, volume, or mix (needs further analysis)
  • Direct materials variance: unfavorable if actual costs > budget; may result from higher prices or inefficiency
  • Direct labor variance: favorable if actual labor costs < budget; could be due to lower wages, fewer hours, or higher efficiency
  • Overhead variance: unfavorable if actual overhead > budget; may be due to fixed or variable cost overruns
  • Net profit variance: overall result of above; requires analysis to determine underlying strengths or concerns

Benefits of comparing actual to master budget

  • Promotes accountability for meeting financial/operational goals
  • Provides operational insights into strengths and weaknesses
  • Enables data-driven decisions using objective variance data

Limitations of comparing actual to master budget

  • Static master budget does not adapt to changing activity levels or business conditions
    • Flexible budgets can address this limitation
  • High-level variances may obscure specific performance drivers
    • Advanced techniques (e.g., price-volume breakdowns) needed for deeper insight
  • Focuses on short-term results, potentially at the expense of long-term strategy
    • Should be balanced with broader performance management tools

Conclusion

  • Master budget variance analysis is foundational for performance management
  • Must be complemented by deeper variance analysis and flexible budgeting
  • Critical thinking and investigation of underlying causes are essential for effective decision-making

More from Cost and variance measures

  • Comparison of actual to planned results