




Comparison of actual to planned results
Learning outcome statements
The learning outcome statements relevant for this section are:
- analyze performance against operational goals using measures based on revenue, manufacturing costs, nonmanufacturing costs, and profit depending on the type of center or unit being measured
- explain the reasons for variances within a performance monitoring system
- prepare a performance analysis by comparing actual results to the master budget, calculate favorable and unfavorable variances from the budget, and provide explanations for variances
- identify and describe the benefits and limitations of measuring performance by comparing actual results to the master budget
Performance analysis across key metrics
Now that the budgets are set, the next step is to measure the actual results against these budgets. This process is typically done by analyzing the differences between budgeted and actual results, referred to as variances.
Variance analysis provides a systematic approach to understanding where performance aligns with or deviates from expectations, helping organizations identify areas for improvement or celebration. Performance is assessed using key metrics tailored to the type of responsibility center or operational focus. These metrics typically include:
- Revenue
Revenue analysis compares actual sales to budgeted sales, identifying variances caused by factors such as price changes, shifts in sales volume, or changes in product mix. - Manufacturing costs
Manufacturing costs include direct materials, direct labor, and manufacturing overhead. Variance analysis for these costs helps organizations pinpoint inefficiencies or unexpected changes in input costs or usage. - Nonmanufacturing costs
Nonmanufacturing costs, such as administrative and selling expenses, are critical to overall profitability. Monitoring these costs ensures they remain aligned with budgeted amounts. - Profitability
Profitability metrics, such as net income and contribution margin, provide an overarching perspective on performance. These metrics incorporate the combined effects of revenue and cost variances, offering a summary view of financial health.
Analyzing these metrics in detail enables organizations to understand the specific drivers behind variances. This granular approach not only clarifies the root causes of performance deviations but also supports more informed and targeted decision-making. The succeeding sections will further break down these metrics, providing deeper insights into why deviations occur and how they can be addressed.
Understanding variances
Variance analysis is a fundamental tool in performance management, providing insights into how actual results compare to planned expectations. These “planned expectations” can be the budgets that we have already discussed and prepared in the previous sections or standards developed for production. Variances are categorized as either favorable or unfavorable, depending on their impact on organizational goals.
These categorizations provide a clear framework for interpreting performance results, serving as the foundation for more detailed variance analysis.
The first step in variance analysis is to calculate the total variance, which represents the overall difference between actual results and the master budget. This total variance provides a high-level picture of how well performance aligns with expectations and is expressed as:
This total variance can then be categorized as favorable or unfavorable, depending on whether it improves or detracts from profitability.
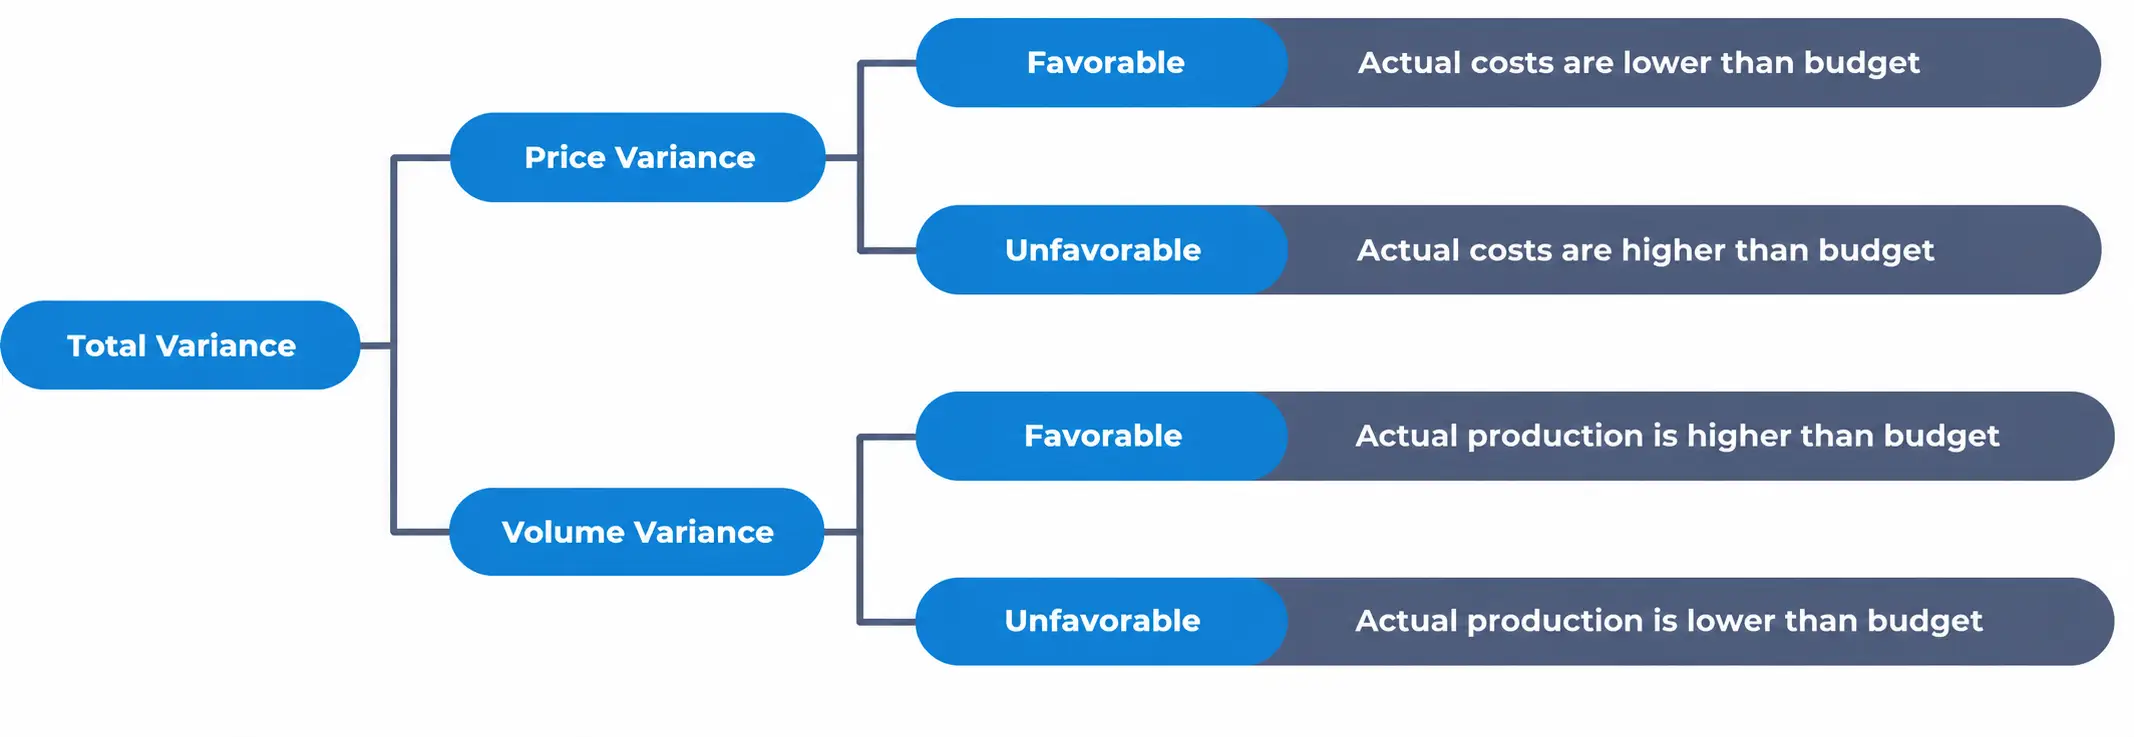
To refine decision-making, the total variance is further broken down into specific components, such as price variances and volume variances. This detailed breakdown allows organizations to identify the root causes of deviations, such as higher-than-expected input prices or lower production volumes.
Common causes of variances
Variances arise from multiple factors, which can either positively or negatively affect performance. Understanding these drivers helps organizations interpret performance results and implement corrective actions. Below are common causes of variances, along with how they may result in favorable or unfavorable outcomes:
1. Price changes of input costs
Price changes related to input costs affect the cost of raw materials, labor, or overhead.
- Favorable input price variances:
These occur when actual input prices are lower than budgeted. Examples include negotiating supplier discounts, benefiting from market price declines, or using alternative materials that are cheaper yet still meet quality standards. Lower utility rates or energy costs can also drive favorable variances. - Unfavorable input price variances:
These arise when input prices exceed expectations. For instance, inflationary pressures, supply chain disruptions, or shortages of raw materials can drive up costs. Wage increases due to labor market conditions or collective bargaining agreements may also cause unfavorable labor price variances.
2. Sales price
Sales price variances occur when the actual selling price of products or services differs from the budgeted price.
- Favorable sales price variances:
These occur when products or services are sold at prices higher than anticipated. This can happen due to strong brand positioning, successful premium pricing strategies, or market conditions allowing for higher price points without sacrificing demand. - Unfavorable sales price variances:
Unfavorable variances occur when actual selling prices are lower than planned. Causes include competitive pressure forcing price reductions, promotional discounts, or shifts in consumer behavior favoring lower-priced alternatives.
3. Volume fluctuations
Volume variances result from differences between actual and budgeted production or sales volumes.
- Favorable volume variances:
Higher-than-expected sales or production volumes spread fixed costs over a larger base, reducing per-unit costs and boosting profitability. For instance, increased demand for a product may drive higher sales volumes, resulting in favorable revenue variances. - Unfavorable volume variances:
Lower-than-expected sales or production volumes increase the per-unit cost of fixed expenses due to underutilization of resources. This can occur during economic downturns, changes in consumer preferences, or operational disruptions leading to reduced production capacity.
4. Product mix
Product mix variances occur when the actual proportion of high-margin versus low-margin products sold deviates from budgeted expectations.
- Favorable product mix variances:
Selling a higher proportion of high-margin products than budgeted increases overall profitability. For example, successful marketing efforts for premium products can result in a favorable product mix variance. - Unfavorable product mix variances:
A shift toward lower-margin products, even if total sales volume meets expectations, can reduce profitability. This may occur due to customer preferences shifting to discounted products or inventory shortages of high-margin items.
5. Operational efficiency
Operational efficiency variances reflect differences in productivity, resource utilization, or waste levels.
- Favorable efficiency variances:
Greater-than-expected efficiency in operations, such as reduced material waste or improved labor productivity, can lead to favorable variances. Process improvements, technological upgrades, or better workforce management are common drivers of these efficiencies. - Unfavorable efficiency variances:
Operational inefficiencies, such as machine downtime, increased material waste, or unproductive labor hours, can result in unfavorable variances. Poor training, inadequate maintenance, or supply chain delays often contribute to these inefficiencies.
6. Market conditions
External factors like customer demand, competition, or economic trends influence market-driven variances. This can influence results but are not normally computed by the company in the variance analysis.
- Favorable market variances:
Positive market conditions, such as higher consumer confidence or reduced competition, can drive increased sales and favorable variances. Favorable regulatory changes or a strong economic environment may also boost performance. - Unfavorable market variances:
Adverse conditions, such as economic downturns, heightened competition, or regulatory changes, can negatively affect revenue and costs. For instance, a recession may lower customer spending, leading to unfavorable revenue variances.
By identifying and analyzing these causes, organizations can better understand the drivers of favorable and unfavorable variances, enabling targeted strategies to address underperformance or capitalize on positive outcomes. For now it is important to know the sources of these variances. We will be discussing how to integrate them in computations in subsequent chapters.