



Calculating and interpreting variances
The master budget, which serves as the benchmark for evaluating performance, is a static budget. A static budget is based on projected revenues and costs for a single level of activity and does not change, even if actual activity levels differ. This fixed nature of the master budget provides a high-level view of planned versus actual results but does not account for variances caused by changes in volume or other factors.
The total variance between actual results and the master budget provides a summary of performance, indicating whether the organization’s overall performance was favorable or unfavorable. However, understanding why the variances occurred requires further analysis, such as breaking them down into price and volume variances, or examining other contributing factors.
Example: Master budget vs. actual results
The table below compares the master budget to actual results for the main line items on an income statement, along with the resulting variance and its favorable/unfavorable label.
| Category | Budgeted
(master budget) |
Actual results | Variance
(Actual results less master budget) |
Type |
| Revenue | $500,000 | $520,000 | $20,000 | Favorable |
| Direct materials | ($150,000) | ($160,000) | ($10,000) | Unfavorable |
| Direct labor | ($100,000) | ($95,000) | $5,000 | Favorable |
| Overhead | ($50,000) | ($55,000) | ($5,000) | Unfavorable |
| Net profit | $200,000 | $210,000 | $10,000 | Favorable |
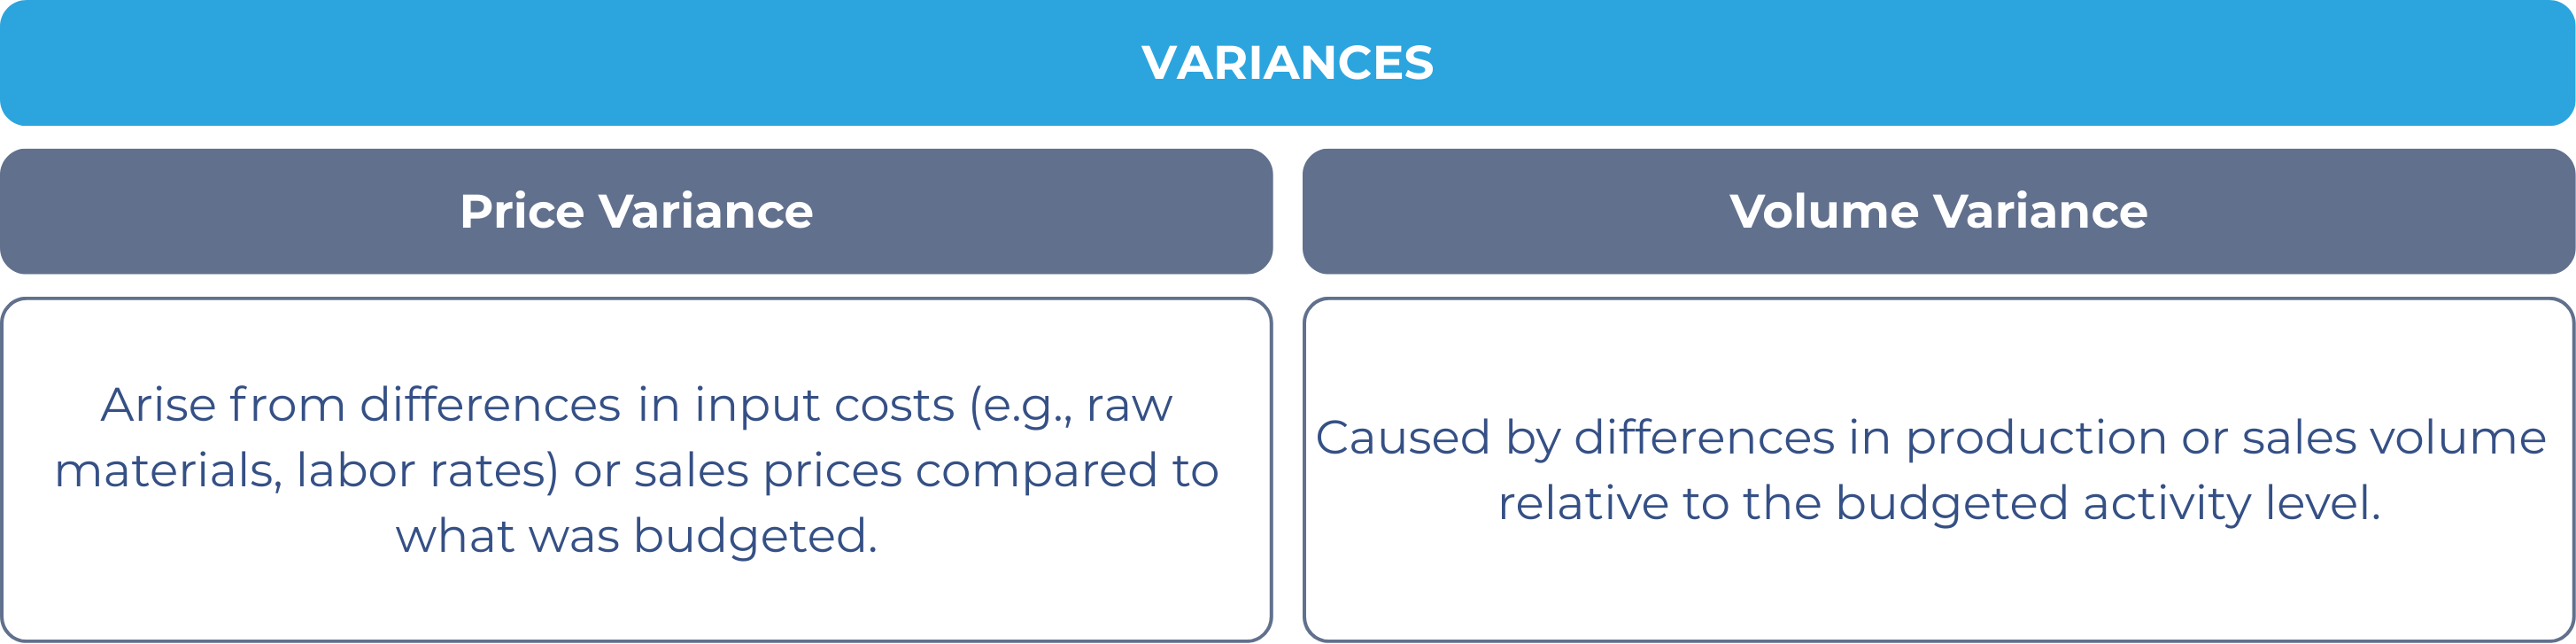
Revenue came in $20,000 above budget and net profit rose $10,000, but a single comparison like this can’t tell you whether that’s from higher prices, higher volume, better efficiency, or some mix of the three. The $10,000 unfavorable materials variance and $5,000 unfavorable overhead variance, for instance, could simply be the expected cost of producing and selling more units rather than genuine overspending. Separating that volume effect from true price and efficiency differences requires breaking the total variance into its components, which later chapters do using flexible budgets and the sales volume variance.
Favorable lines need the same scrutiny. The $5,000 favorable direct labor variance might come from lower wage rates, fewer labor hours, or improved efficiency, but without more detailed data it is unclear whether it is entirely favorable or masks other issues, such as insufficient staffing. Rather than simply categorizing variances as favorable or unfavorable, managers should investigate the underlying causes and their implications.
Comparing actual results to the master budget is a useful starting point for performance management, but it has both benefits and limitations worth understanding before relying on it further.
Benefits of comparing actual to master budget
- Accountability - Comparing actual results to the master budget holds responsibility centers (cost centers, profit centers, and investment centers) accountable for meeting their planned targets, which motivates managers and employees to align their actions with organizational goals.
- Operational insights - Favorable variances point to effective strategies, such as a successful marketing campaign driving higher-than-expected sales, while unfavorable variances flag areas needing improvement, such as inefficient material usage or labor productivity.
- Data-driven decisions - The master budget provides an objective baseline, so variances guide corrective actions, such as adjusting procurement strategies in response to rising input costs or revising sales forecasts based on actual market conditions.
Limitations of comparing actual to master budget
- Static nature of master budgets - The master budget is based on a single set of assumptions about activity levels, costs, and revenues, so it doesn’t adapt when actual volume differs significantly from the plan. Flexible budgets, which adjust for actual activity levels, address this limitation.
- Aggregation hides specific drivers - Variances calculated against the master budget are summarized at a high level, which can obscure more specific performance drivers - a favorable total revenue variance, for example, may mask unfavorable results in certain product lines or regions. Price-volume variance breakdowns and contribution margin analysis help uncover these underlying factors.
- Focus on short-term results - Emphasizing period-to-period variances can lead a department to delay necessary investments or avoid short-term expenses just to meet budgeted targets, potentially compromising long-term growth or operational efficiency. Balanced scorecards and other KPI-based tools help offset this short-term focus.
Conclusion
Comparing actual results to the master budget is a necessary starting point for performance management, but its central weakness is that it can’t separate the effect of changing volume from true price or efficiency differences. The chapters that follow address this by introducing flexible budgets and by breaking total variances down into price and volume components.