


This browser is too old to run Achievable.

Update it, or open this page in a current version of Chrome, Safari, Firefox or Edge. On an iPhone or iPad, update iOS: every browser there runs on the version of Safari that comes with it.

Achievable logoAchievable logo
CMA Part 1
Sign in
Sign up
Purchase
Textbook
Practice exams
Support
How it works
Resources
Exam catalog
Mountain with a flag at the peak
Textbook
Introduction
1. External financial reporting decisions
2. Planning, budgeting, and forecasting
3. Performance management
4. Cost management
5. Internal control
6. Technology and analytics
Wrapping up
Achievable logoAchievable logo
1.2.2.5 Inventory systems: perpetual
Achievable CMA Part 1
1. External financial reporting decisions
1.2. Financial transactions
1.2.2. Inventory
Our CMA Part 1 course is currently in development and is a work-in-progress.

Inventory systems: perpetual

12 min read
Font
Discuss
Share
Feedback

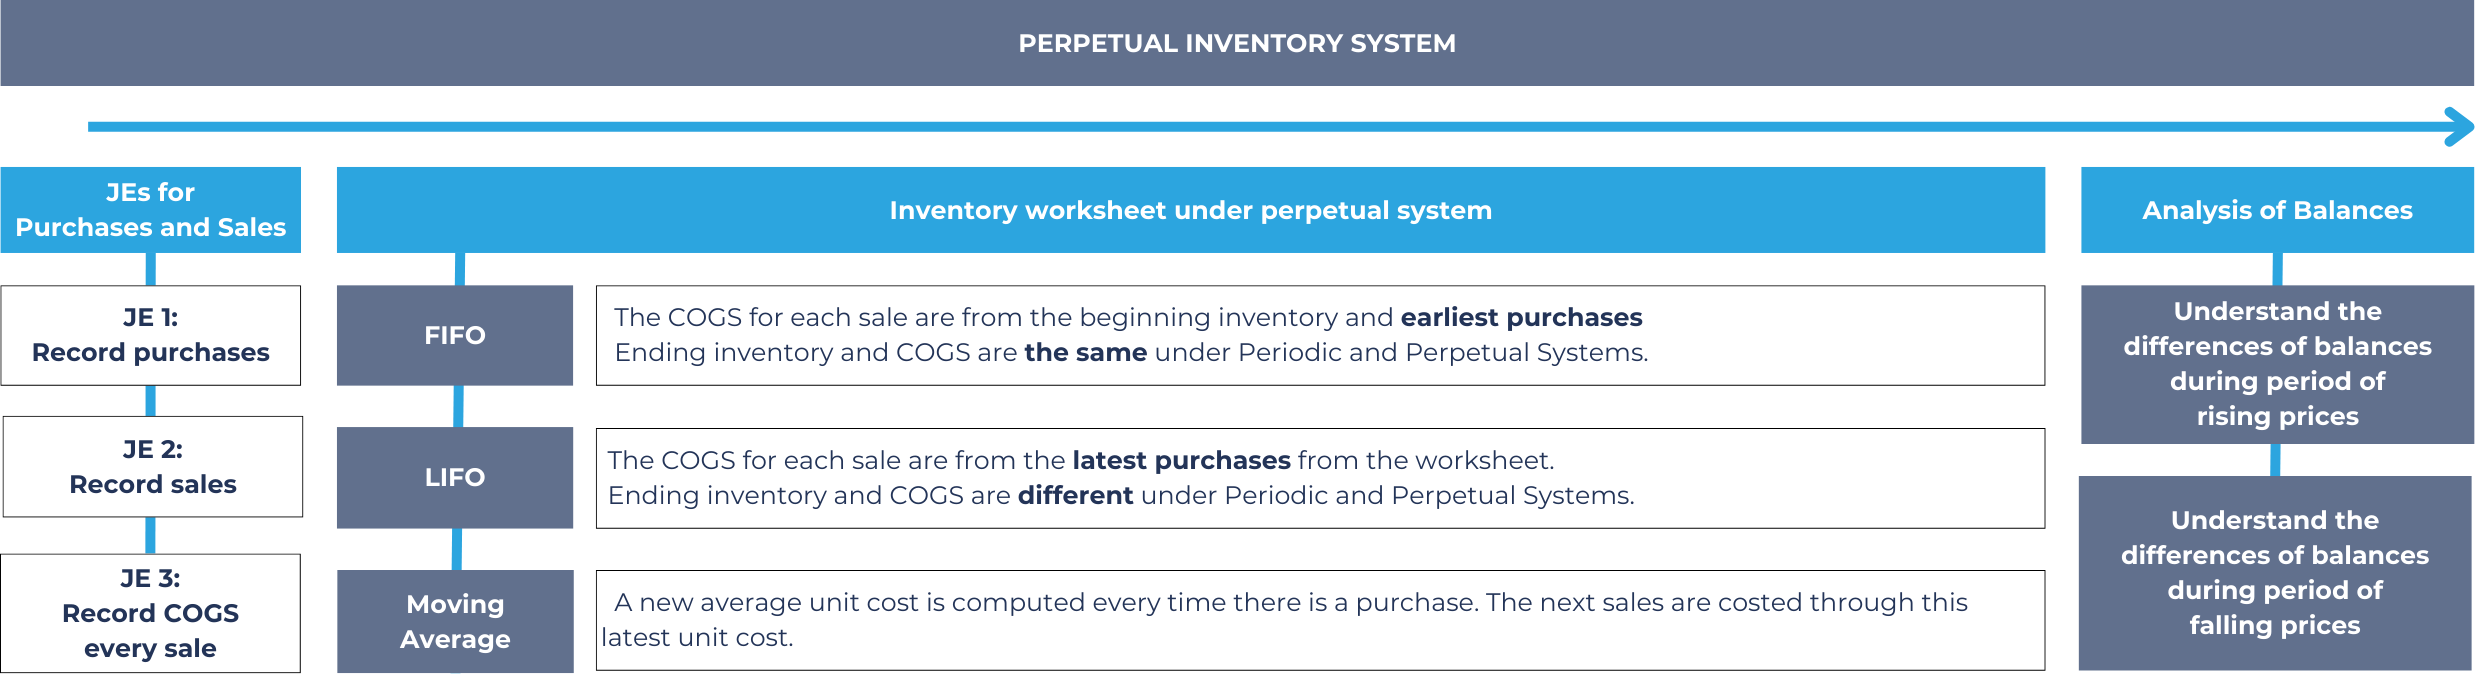
The following concept map for the perpetual inventory system could be helpful to navigate through the topic:

Concept map for perpetual inventory system
Achievable

Perpetual inventory system

Under the perpetual inventory system, inventory and cost of goods sold are updated in real time with every purchase and sale, rather than being determined at the end of the period as under the periodic system.

Journal entries under the perpetual system

Under the perpetual inventory system, a journal entry is generated at each purchase and sale that shows the effects of the transactions to the company’s inventory and cost of goods sold immediately.

The journal entry to record a purchase increases the “inventory” account on the balance sheet instead of a “purchases” account on the income statement. There are then two journal entries every time a sale occurs: one for the sale itself (the same entry used under the periodic system), and one for the cost of goods sold (only recorded under the perpetual system). The second entry reduces the inventory balance and transfers that cost to COGS with each sale.

Entry Account Debit Credit Financial statement element
JE 1 - record purchase Inventory XXX Asset
Cash or accounts payable XXX Asset or liability
JE 2 - record sale Cash or accounts receivable XXX Asset
Sales revenue XXX Revenue
JE 3 - record COGS Cost of goods sold XXX Expense
Inventory XXX Asset

No year-end entry is needed to compute COGS, because inventory and COGS are updated with every transaction. Companies still take a periodic physical count and record an adjusting entry (debit COGS or inventory shrinkage, credit Inventory) for any shortage between the records and the count.

Inventory worksheet under perpetual system

Unlike the periodic inventory system, which is easily learned using journal entries, the perpetual inventory system is best learned using inventory worksheets, prepared slightly differently for each cost flow assumption.

From here, we can analyze the impacts of each transaction instead of just the ending balances. We will use the same facts in the exercise used in the periodic inventory system to be able to compare the results with the perpetual inventory system.

Example: Below is the summary of inventory movements for the month of April (a period of rising prices) for Achievable:

Date Nature Units Cost Total
Apr 1 Beginning inventory 500 $2.0 $1,000
Apr 2 Purchase 1,000 $2.5 $2,500
Apr 5 Purchase 1,000 $3.0 $3,000
Apr 9 Sale (Per unit: $7.00) (800)    
Apr 15 Purchase 1,500 $4.0 $6,000
Apr 29 Sale (Per unit: 8.00) (1,200)    
  Goods available for sale 4,000   12,500
Apr 30 Ending inventory 2,000    

FIFO perpetual assumption

Before working through a perpetual worksheet, you should know that FIFO periodic and FIFO perpetual always produce the same ending inventory and COGS balances - $7,500 and $5,000 in this example. That’s because FIFO always assigns the earliest purchases to COGS first, regardless of when each sale happens during the period, so the order in which you match units to costs doesn’t change the outcome. If you’re asked to compute FIFO perpetual, you can use the faster FIFO periodic method (shown in the previous chapter) and arrive at the same result.

LIFO perpetual assumption

LIFO is permitted under U.S. GAAP but prohibited under IFRS; the GAAP-IFRS differences chapter covers this comparison in more detail.

Under LIFO perpetual, each sale draws on the most recent purchases on hand at the time of that sale, so results can differ from LIFO periodic and must be worked out with an inventory worksheet, like the one below.

Date Nature Transactions Inventory Cost of goods sold
Units Cost Total Units Cost Total Units Cost Total
Apr 1 Beginning inventory 500 $2.0 $1,000 500 $2.0 $1,000
Apr 2 Purchase 1,000 $2.5 $2,500 1,000 $2.5 $2,500
Apr 5 Purchase 1,000 $3.0 $3,000 1,000 $3.0 $3,000
Apr 9 Sale (Per unit: $7.00) (800)
From Apr 5 purchase (800) $3.0 ($2,400) 800 $3.0 $2,400
Apr 15 Purchase 1,500 $4.0 $6,000 1,500 $4.0 $6,000
Apr 29 Sale (Per unit: $8.00) (1,200)
From Apr 15 purchase (1,200) $4.0 ($4,800) 1,200 $4.0 $4,800
Apr 30 Ending inventory 2,000   2,000 $5,300 2,000 $7,200

The difference with FIFO perpetual is that the sales are attributed to the latest inventories purchased.

You will notice that the total inventories ($ 5,300) and the COGS ($ 7,200) are still equal to the cost of goods available for sale of $ 12,500. This will be true for all methods and cost flow assumptions we will discuss.

Moving average assumption

Under the perpetual inventory system, the average method is called the moving average method because for every purchase, the average inventory cost is computed and there is no single average cost of inventory unlike the weighted average method in the periodic inventory system.

Date Nature Transactions Inventory Cost of goods sold
Units Cost Total Units Avg. cost Total Units Avg. cost Total
Apr 1 Beginning inventory 500 $2.0 $1,000 500 $2.0 $1,000
Apr 2 Purchase 1,000 $2.5 $2,500 1,000 $2.5 $2,500
Apr 5 Purchase 1,000 $3.0 $3,000 1,000 $3.0 $3,000
Average cost/ accumulated balance 2,500 $2.6 $6,500
Apr 9 Sale (Per unit: $7.00) (800) (800) $2.6 ($2,080) 800 $2.6 $2,080
Apr 15 Purchase 1,500 $4.0 $6,000 1,500 $4.0 $6,000
Average cost/ accumulated balance 3,200 $3.26 $10,420
Apr 29 Sale (Per unit: $8.00) (1,200) (1,200) $3.26 ($3,912) 1,200 $3.26 $3,912
Apr 30 Ending inventory 2,000   2,000 $6,508 2,000 $5,992

Because no sale occurs until April 9, we compute one combined average after the April 5 purchase.

The average unit cost is rounded at each step ($10,420÷3,200 units=$3.256, shown as $3.26), which is why 1,200×$3.26=$3,912 rather than a more precise figure.

Analysis of the ending balances under the perpetual system

Below is a summary of the ending inventory, sales, cost of goods sold, and gross profit under all cost flow assumptions of the perpetual inventory system. Recall that April is a period of rising prices for the company.

Units FIFO LIFO Moving ave.
Balance sheet:        
Ending inventory 2,000 $ 7,500 $ 5,300 $ 6,508
         
Income statement:        
Sales* 2,000 $ 15,200 $ 15,200 $ 15,200
Cost of goods sold 2,000 ($ 5,000) ($ 7,200) ($ 5,992)
Gross profit $ 10,200 $ 8,000 $ 9,208

The amount of sales is the total sales (Apr 9 and Apr 29) from the example.

In a period of rising prices, the example shows the following:

  1. FIFO method has the highest gross profit because the cost of goods sold are based on the lower priced inventory items of the old purchases
  2. In effect of above, in a period of rising prices, LIFO has a higher cost of goods sold
  3. FIFO has the higher cost of ending inventory in the balance sheet because these are based on the higher priced most current purchases
  4. The average method is expected to be in the middle of both FIFO and LIFO.

Comparing the perpetual and periodic systems, only FIFO produces identical ending inventory and COGS under both; LIFO and the average method generally do not.

Perpetual inventory system basics

  • Inventory and COGS updated in real time with every purchase/sale (not just at period end like periodic system)
  • Purchases debited directly to Inventory (not a “Purchases” account)
  • Every sale triggers two journal entries: one for the sale (debit cash/AR, credit sales revenue) and one for COGS (debit COGS, credit Inventory)
  • No year-end COGS calculation needed; physical counts still done, with adjusting entries for shrinkage (debit COGS/shrinkage, credit Inventory)

Inventory worksheets

  • Perpetual system tracked using inventory worksheets (not simple journal entries) since costs shift with each transaction
  • Worksheet tracks three sections: Transactions, Inventory, and Cost of Goods Sold, updated line-by-line
  • Ending Inventory + COGS always equal total Goods Available for Sale, regardless of method

FIFO perpetual

  • Always yields same ending inventory and COGS as FIFO periodic
  • Earliest costs always assigned to COGS first, regardless of sale timing
  • Can shortcut by using FIFO periodic calculations

LIFO perpetual

  • Each sale draws from most recent purchases on hand at that sale’s time — differs from LIFO periodic
  • Must use inventory worksheet (no shortcut), since results depend on transaction order
  • LIFO allowed under U.S. GAAP, prohibited under IFRS

Moving average (perpetual average) method

  • Recalculates average cost after each purchase (not one single weighted average like periodic)
  • Average cost rounded at each step, causing minor calculation differences
  • Formula: new average cost = total inventory cost ÷ total units after each purchase

Comparing cost flow results (rising price environment)

  • FIFO: highest ending inventory & gross profit, lowest COGS (uses older, cheaper costs for COGS)
  • LIFO: lowest ending inventory & gross profit, highest COGS (uses newer, pricier costs for COGS)
  • Moving average: results fall between FIFO and LIFO
  • Only FIFO gives identical results under both perpetual and periodic systems; LIFO and average methods typically differ between the two systems

Sign up for free to take 15 quiz questions on this topic

Previous
Next  | 1.2.2.6 Inventory valuation
All rights reserved ©2016 - 2026 Achievable, Inc.

Inventory systems: perpetual

The following concept map for the perpetual inventory system could be helpful to navigate through the topic:

Perpetual inventory system

Under the perpetual inventory system, inventory and cost of goods sold are updated in real time with every purchase and sale, rather than being determined at the end of the period as under the periodic system.

Journal entries under the perpetual system

Under the perpetual inventory system, a journal entry is generated at each purchase and sale that shows the effects of the transactions to the company’s inventory and cost of goods sold immediately.

The journal entry to record a purchase increases the “inventory” account on the balance sheet instead of a “purchases” account on the income statement. There are then two journal entries every time a sale occurs: one for the sale itself (the same entry used under the periodic system), and one for the cost of goods sold (only recorded under the perpetual system). The second entry reduces the inventory balance and transfers that cost to COGS with each sale.

Entry Account Debit Credit Financial statement element
JE 1 - record purchase Inventory XXX Asset
Cash or accounts payable XXX Asset or liability
JE 2 - record sale Cash or accounts receivable XXX Asset
Sales revenue XXX Revenue
JE 3 - record COGS Cost of goods sold XXX Expense
Inventory XXX Asset

No year-end entry is needed to compute COGS, because inventory and COGS are updated with every transaction. Companies still take a periodic physical count and record an adjusting entry (debit COGS or inventory shrinkage, credit Inventory) for any shortage between the records and the count.

Inventory worksheet under perpetual system

Unlike the periodic inventory system, which is easily learned using journal entries, the perpetual inventory system is best learned using inventory worksheets, prepared slightly differently for each cost flow assumption.

From here, we can analyze the impacts of each transaction instead of just the ending balances. We will use the same facts in the exercise used in the periodic inventory system to be able to compare the results with the perpetual inventory system.

Example: Below is the summary of inventory movements for the month of April (a period of rising prices) for Achievable:

Date Nature Units Cost Total
Apr 1 Beginning inventory 500 $2.0 $1,000
Apr 2 Purchase 1,000 $2.5 $2,500
Apr 5 Purchase 1,000 $3.0 $3,000
Apr 9 Sale (Per unit: $7.00) (800)    
Apr 15 Purchase 1,500 $4.0 $6,000
Apr 29 Sale (Per unit: 8.00) (1,200)    
  Goods available for sale 4,000   12,500
Apr 30 Ending inventory 2,000    

FIFO perpetual assumption

Before working through a perpetual worksheet, you should know that FIFO periodic and FIFO perpetual always produce the same ending inventory and COGS balances - $7,500 and $5,000 in this example. That’s because FIFO always assigns the earliest purchases to COGS first, regardless of when each sale happens during the period, so the order in which you match units to costs doesn’t change the outcome. If you’re asked to compute FIFO perpetual, you can use the faster FIFO periodic method (shown in the previous chapter) and arrive at the same result.

LIFO perpetual assumption

LIFO is permitted under U.S. GAAP but prohibited under IFRS; the GAAP-IFRS differences chapter covers this comparison in more detail.

Under LIFO perpetual, each sale draws on the most recent purchases on hand at the time of that sale, so results can differ from LIFO periodic and must be worked out with an inventory worksheet, like the one below.

Date Nature Transactions Inventory Cost of goods sold
Units Cost Total Units Cost Total Units Cost Total
Apr 1 Beginning inventory 500 $2.0 $1,000 500 $2.0 $1,000
Apr 2 Purchase 1,000 $2.5 $2,500 1,000 $2.5 $2,500
Apr 5 Purchase 1,000 $3.0 $3,000 1,000 $3.0 $3,000
Apr 9 Sale (Per unit: $7.00) (800)
From Apr 5 purchase (800) $3.0 ($2,400) 800 $3.0 $2,400
Apr 15 Purchase 1,500 $4.0 $6,000 1,500 $4.0 $6,000
Apr 29 Sale (Per unit: $8.00) (1,200)
From Apr 15 purchase (1,200) $4.0 ($4,800) 1,200 $4.0 $4,800
Apr 30 Ending inventory 2,000   2,000 $5,300 2,000 $7,200

The difference with FIFO perpetual is that the sales are attributed to the latest inventories purchased.

You will notice that the total inventories ($ 5,300) and the COGS ($ 7,200) are still equal to the cost of goods available for sale of $ 12,500. This will be true for all methods and cost flow assumptions we will discuss.

Moving average assumption

Under the perpetual inventory system, the average method is called the moving average method because for every purchase, the average inventory cost is computed and there is no single average cost of inventory unlike the weighted average method in the periodic inventory system.

Date Nature Transactions Inventory Cost of goods sold
Units Cost Total Units Avg. cost Total Units Avg. cost Total
Apr 1 Beginning inventory 500 $2.0 $1,000 500 $2.0 $1,000
Apr 2 Purchase 1,000 $2.5 $2,500 1,000 $2.5 $2,500
Apr 5 Purchase 1,000 $3.0 $3,000 1,000 $3.0 $3,000
Average cost/ accumulated balance 2,500 $2.6 $6,500
Apr 9 Sale (Per unit: $7.00) (800) (800) $2.6 ($2,080) 800 $2.6 $2,080
Apr 15 Purchase 1,500 $4.0 $6,000 1,500 $4.0 $6,000
Average cost/ accumulated balance 3,200 $3.26 $10,420
Apr 29 Sale (Per unit: $8.00) (1,200) (1,200) $3.26 ($3,912) 1,200 $3.26 $3,912
Apr 30 Ending inventory 2,000   2,000 $6,508 2,000 $5,992

Because no sale occurs until April 9, we compute one combined average after the April 5 purchase.

The average unit cost is rounded at each step ($10,420÷3,200 units=$3.256, shown as $3.26), which is why 1,200×$3.26=$3,912 rather than a more precise figure.

Analysis of the ending balances under the perpetual system

Below is a summary of the ending inventory, sales, cost of goods sold, and gross profit under all cost flow assumptions of the perpetual inventory system. Recall that April is a period of rising prices for the company.

Units FIFO LIFO Moving ave.
Balance sheet:        
Ending inventory 2,000 $ 7,500 $ 5,300 $ 6,508
         
Income statement:        
Sales* 2,000 $ 15,200 $ 15,200 $ 15,200
Cost of goods sold 2,000 ($ 5,000) ($ 7,200) ($ 5,992)
Gross profit $ 10,200 $ 8,000 $ 9,208

The amount of sales is the total sales (Apr 9 and Apr 29) from the example.

In a period of rising prices, the example shows the following:

  1. FIFO method has the highest gross profit because the cost of goods sold are based on the lower priced inventory items of the old purchases
  2. In effect of above, in a period of rising prices, LIFO has a higher cost of goods sold
  3. FIFO has the higher cost of ending inventory in the balance sheet because these are based on the higher priced most current purchases
  4. The average method is expected to be in the middle of both FIFO and LIFO.

Comparing the perpetual and periodic systems, only FIFO produces identical ending inventory and COGS under both; LIFO and the average method generally do not.

Key points

Perpetual inventory system basics

  • Inventory and COGS updated in real time with every purchase/sale (not just at period end like periodic system)
  • Purchases debited directly to Inventory (not a “Purchases” account)
  • Every sale triggers two journal entries: one for the sale (debit cash/AR, credit sales revenue) and one for COGS (debit COGS, credit Inventory)
  • No year-end COGS calculation needed; physical counts still done, with adjusting entries for shrinkage (debit COGS/shrinkage, credit Inventory)

Inventory worksheets

  • Perpetual system tracked using inventory worksheets (not simple journal entries) since costs shift with each transaction
  • Worksheet tracks three sections: Transactions, Inventory, and Cost of Goods Sold, updated line-by-line
  • Ending Inventory + COGS always equal total Goods Available for Sale, regardless of method

FIFO perpetual

  • Always yields same ending inventory and COGS as FIFO periodic
  • Earliest costs always assigned to COGS first, regardless of sale timing
  • Can shortcut by using FIFO periodic calculations

LIFO perpetual

  • Each sale draws from most recent purchases on hand at that sale’s time — differs from LIFO periodic
  • Must use inventory worksheet (no shortcut), since results depend on transaction order
  • LIFO allowed under U.S. GAAP, prohibited under IFRS

Moving average (perpetual average) method

  • Recalculates average cost after each purchase (not one single weighted average like periodic)
  • Average cost rounded at each step, causing minor calculation differences
  • Formula: new average cost = total inventory cost ÷ total units after each purchase

Comparing cost flow results (rising price environment)

  • FIFO: highest ending inventory & gross profit, lowest COGS (uses older, cheaper costs for COGS)
  • LIFO: lowest ending inventory & gross profit, highest COGS (uses newer, pricier costs for COGS)
  • Moving average: results fall between FIFO and LIFO
  • Only FIFO gives identical results under both perpetual and periodic systems; LIFO and average methods typically differ between the two systems

More from Inventory

  • Learning outcomes
  • Inventory ownership and capitalization
  • Inventory cost flow assumptions
  • Inventory systems: periodic
  • Inventory valuation