
This browser is too old to run Achievable.

Update it, or open this page in a current version of Chrome, Safari, Firefox or Edge. On an iPhone or iPad, update iOS: every browser there runs on the version of Safari that comes with it.

Achievable logoAchievable logo
CMA Part 1
Sign in
Sign up
Purchase
Textbook
Practice exams
Support
How it works
Resources
Exam catalog
Mountain with a flag at the peak
Textbook
Introduction
1. External financial reporting decisions
2. Planning, budgeting, and forecasting
3. Performance management
4. Cost management
4.1 Measurement concepts
4.2 Costing systems
4.3 Overhead costs
4.3.1 Overhead classification and cost behavior
4.3.2 Overhead allocation methods
4.3.3 Overapplied and underapplied overhead
4.3.4 Allocation of service department costs: overview
4.3.5 Allocation of service department costs: direct method
4.3.6 Allocation of service department costs: step-down method
4.3.7 Allocation of service department costs: reciprocal method
4.4 Supply chain management
4.5 Business process improvement
5. Internal control
6. Technology and analytics
Wrapping up
Achievable logoAchievable logo
4.3.3 Overapplied and underapplied overhead
Achievable CMA Part 1
4. Cost management
4.3. Overhead costs
Our CMA Part 1 course is currently in development and is a work-in-progress.

Overapplied and underapplied overhead

6 min read
Font
Discuss
Share
Feedback

In a manufacturing setting, overhead costs are applied to production using a predetermined overhead rate. Since this rate is based on estimates, the actual overhead incurred will almost always differ from the overhead applied, resulting in either overapplied or underapplied overhead. Understanding and accounting for these differences is critical for accurate cost reporting and financial statement preparation.

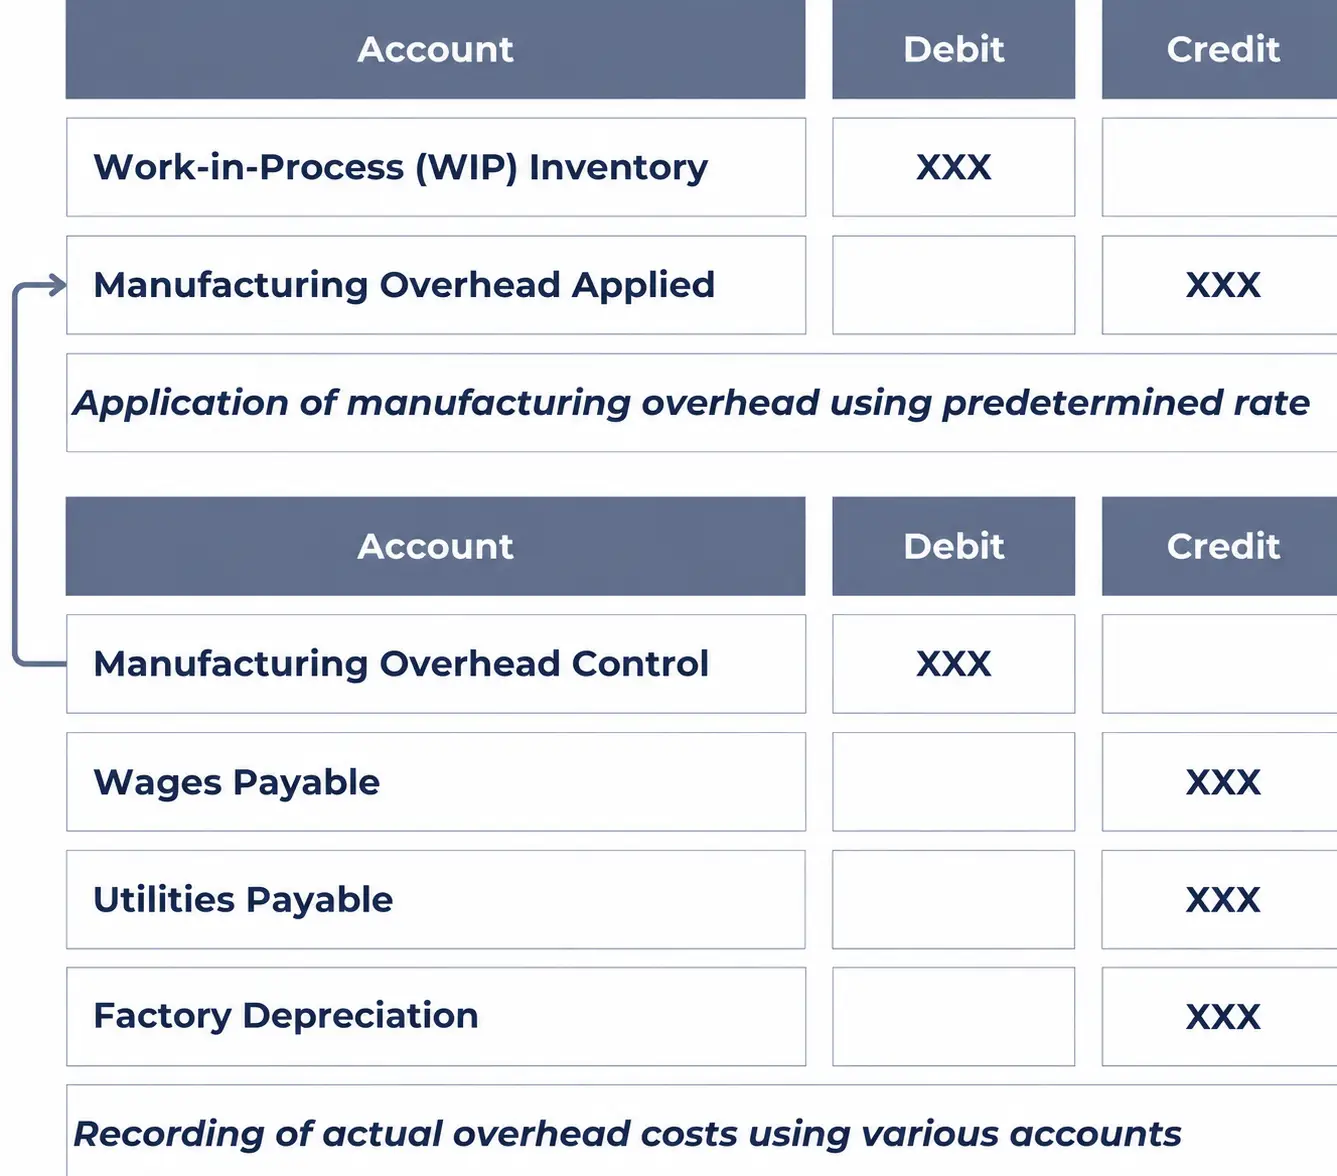
The following are the journal entries throughout the production process that ultimately leads to the over/under application of overhead costs:

Recording application of manufacturing overhead and actual overhead costs incurred.
Overhead Journal Entries
Achievable

Determining overapplied or underapplied overhead

At the end of the accounting period, the organization must reconcile the applied overhead (estimated using a predetermined rate) with the actual overhead incurred during production. This comparison determines whether overhead has been overapplied or underapplied.

Applied overhead equals the predetermined rate times actual activity, so it differs from actual overhead when spending differs from budget or when actual activity differs from the rate’s denominator level - the main source of the gap for fixed overhead. A balance that recurs in the same direction signals the rate should be revised.

This reconciliation is directly related to the two key journal entries presented in the previous table:

  • Actual overhead costs are accumulated in the manufacturing overhead control account (e.g., for utilities, depreciation, indirect materials).
  • Applied overhead is recorded in the manufacturing overhead applied account as overhead is assigned to production using the predetermined rate.

Ideally, these two accounts should net to zero, meaning all actual costs were accurately allocated to production. However, differences almost always arise:

  • Overapplied overhead: applied overhead exceeds actual overhead (Applied overhead>Actual overhead), so the amount overapplied equals applied minus actual overhead. This means more overhead was assigned to jobs than was actually incurred, resulting in a credit balance. Unadjusted, inventory and COGS are overstated and operating income is understated.

  • Underapplied overhead: applied overhead is less than actual overhead (Applied overhead<Actual overhead), so the amount underapplied equals actual minus applied overhead. This means less overhead was assigned to jobs than was actually incurred, resulting in a debit balance. Unadjusted, inventory and COGS are understated and operating income is overstated.

The treatment of this difference depends on its materiality:

The difference is not material The difference is typically closed directly to the cost of goods sold account. Using the below journal entries:

Recording of immaterial over- or under-applied overhead

The difference is material The difference should be allocated proportionally across work-in-process (WIP), finished goods (FG), and COGS. The preferred basis is the applied overhead included in each account’s ending balance; an alternative is each account’s total ending balance.

Recording of material over- or under-applied overhead

Example: Prorating underapplied overhead

Actual overhead for the period is $620,000 and applied overhead is $600,000, so overhead is underapplied by $20,000. Applied overhead included in the ending balances of WIP, FG, and COGS is $60,000, $90,000, and $450,000, respectively - a total of $600,000.

  • WIP’s share: 600,00060,000​×20,000=2,000
  • FG’s share: 600,00090,000​×20,000=3,000
  • COGS’s share: 600,000450,000​×20,000=15,000

Answer: Debit MOH applied $600,000, debit WIP $2,000, debit FG $3,000, and debit COGS $15,000; credit MOH control $620,000. This closes both accounts and clears the $20,000 underapplied balance. (With a single manufacturing overhead account, the entry is the three debits and a $20,000 credit to manufacturing overhead.)

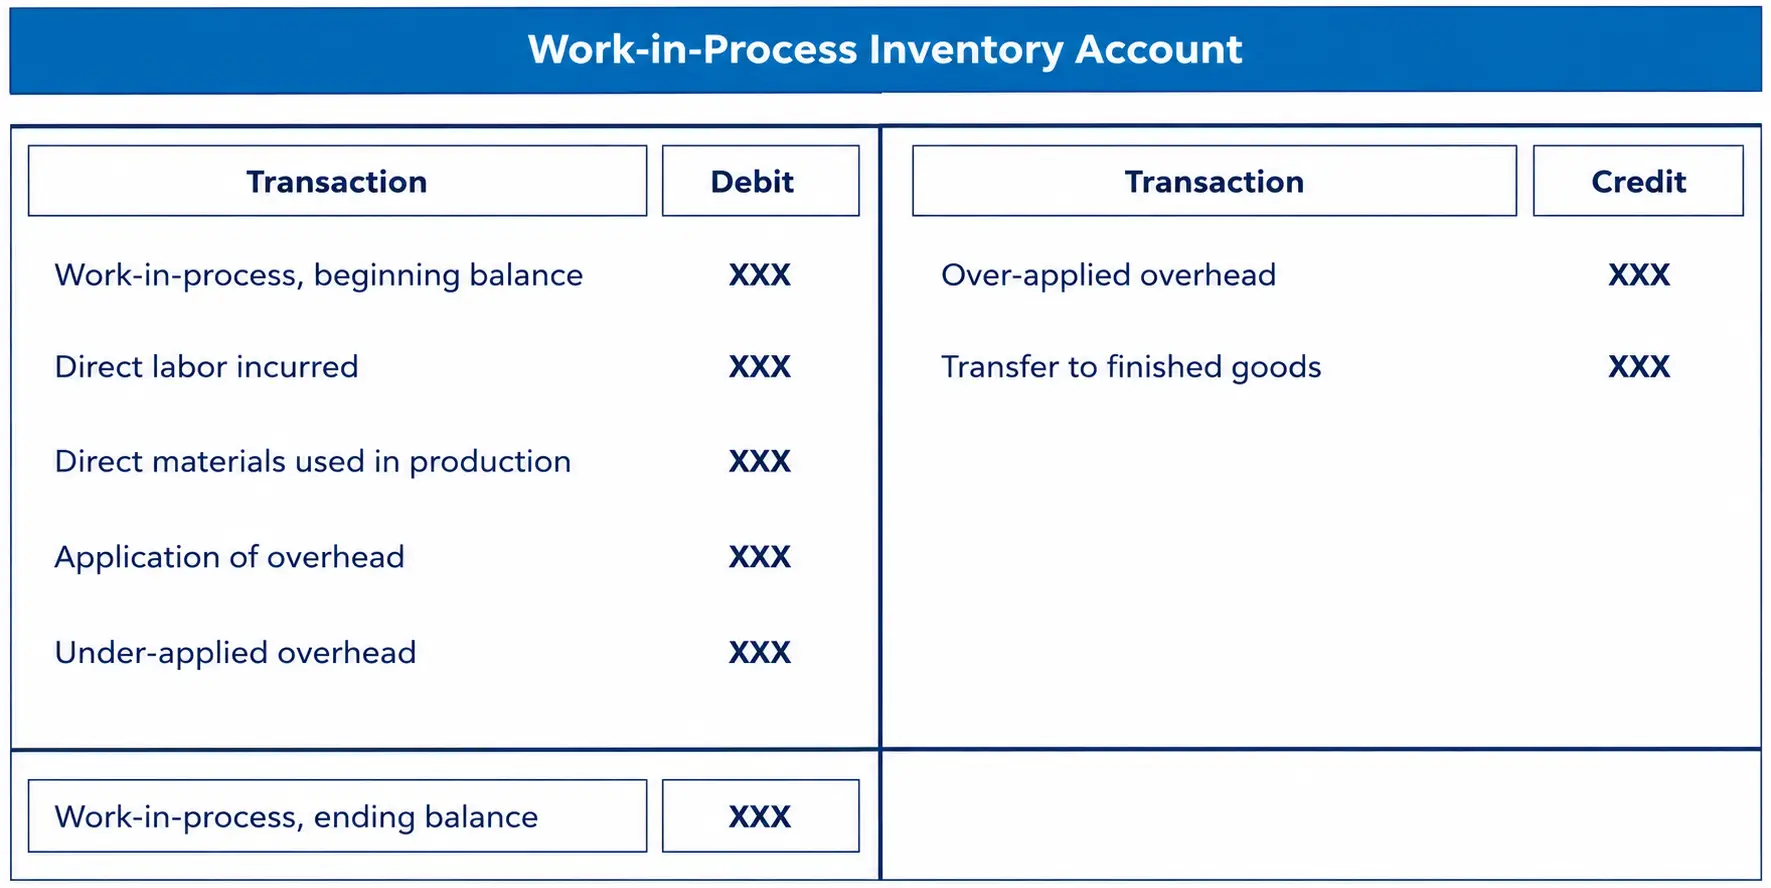
Style table of Work-in-Process Inventory debits and credits including labor, materials, and overhead entries.
WIP T-Account
Achievable

Summary: overhead application and adjustment flow

  1. Overhead is applied to WIP using a predetermined rate.
  2. Actual overhead is incurred and recorded separately.
  3. The difference (if any) results in over- or underapplied overhead.
  4. This difference is either: closed to COGS (for immaterial balances), or prorated among WIP, FG, and COGS (for material balances).

Activity-based overhead allocation

While traditional overhead allocation methods (e.g., corporate-wide or departmental rates) apply overhead using a single or limited number of allocation bases, activity-based costing (ABC) offers a more refined and accurate approach. In ABC, overhead costs are traced to activities, then assigned to products or services based on their actual consumption of those activities.

Since a comprehensive discussion of ABC is already provided in the activity-based costing section of this textbook, you are encouraged to refer to that section for the following topics:

  • The rationale and strategic value of ABC
  • Key elements: cost pool, cost driver, resource driver, activity driver, and value-added activity
  • Calculation of overhead using ABC
  • Comparison of ABC to traditional overhead systems
  • Practical applications and limitations

In summary, ABC is especially useful when overhead costs are high and diverse, and when multiple products or services consume activities at different rates. It supports better decision-making in pricing, product design, and cost control.

Overhead application journal entries

  • Actual overhead (utilities, depreciation, indirect materials) recorded in manufacturing overhead control account
  • Applied overhead (predetermined rate × actual activity) recorded in manufacturing overhead applied account
  • Ideally these two accounts net to zero; differences are the norm

Causes and types of over/underapplied overhead

  • Applied overhead = predetermined rate × actual activity; gaps arise from spending differing from budget or actual activity differing from the rate’s denominator level (main driver for fixed overhead)
  • Overapplied: Applied > Actual → credit balance; unadjusted, inventory/COGS overstated, operating income understated
  • Underapplied: Applied < Actual → debit balance; unadjusted, inventory/COGS understated, operating income overstated
  • A recurring imbalance in the same direction signals the predetermined rate needs revision

Treatment of the difference: immaterial vs. material

  • Immaterial: closed entirely to Cost of Goods Sold (COGS)
  • Material: prorated across WIP, Finished Goods (FG), and COGS
    • Preferred basis: applied overhead included in each account’s ending balance
    • Alternative basis: each account’s total ending balance
  • Proration formula: account’s share=total applied overheadaccount’s applied overhead​×over/underapplied amount
  • Example: $20,000 underapplied prorated using $600,000 total applied overhead → WIP $2,000, FG $3,000, COGS $15,000 (debits), closing both overhead accounts

Activity-based costing (ABC) overview

  • Traces overhead to activities first, then assigns to products based on actual consumption (vs. single/limited traditional allocation bases)
  • Key elements: cost pool, cost driver, resource driver, activity driver, value-added activity
  • Most useful when overhead is high/diverse and products consume activities at different rates; improves pricing, product design, and cost control decisions

Sign up for free to take 8 quiz questions on this topic

Previous
Next  | 4.3.4 Allocation of service department costs: overview
All rights reserved ©2016 - 2026 Achievable, Inc.

Overapplied and underapplied overhead

In a manufacturing setting, overhead costs are applied to production using a predetermined overhead rate. Since this rate is based on estimates, the actual overhead incurred will almost always differ from the overhead applied, resulting in either overapplied or underapplied overhead. Understanding and accounting for these differences is critical for accurate cost reporting and financial statement preparation.

The following are the journal entries throughout the production process that ultimately leads to the over/under application of overhead costs:

Determining overapplied or underapplied overhead

At the end of the accounting period, the organization must reconcile the applied overhead (estimated using a predetermined rate) with the actual overhead incurred during production. This comparison determines whether overhead has been overapplied or underapplied.

Applied overhead equals the predetermined rate times actual activity, so it differs from actual overhead when spending differs from budget or when actual activity differs from the rate’s denominator level - the main source of the gap for fixed overhead. A balance that recurs in the same direction signals the rate should be revised.

This reconciliation is directly related to the two key journal entries presented in the previous table:

  • Actual overhead costs are accumulated in the manufacturing overhead control account (e.g., for utilities, depreciation, indirect materials).
  • Applied overhead is recorded in the manufacturing overhead applied account as overhead is assigned to production using the predetermined rate.

Ideally, these two accounts should net to zero, meaning all actual costs were accurately allocated to production. However, differences almost always arise:

  • Overapplied overhead: applied overhead exceeds actual overhead (Applied overhead>Actual overhead), so the amount overapplied equals applied minus actual overhead. This means more overhead was assigned to jobs than was actually incurred, resulting in a credit balance. Unadjusted, inventory and COGS are overstated and operating income is understated.

  • Underapplied overhead: applied overhead is less than actual overhead (Applied overhead<Actual overhead), so the amount underapplied equals actual minus applied overhead. This means less overhead was assigned to jobs than was actually incurred, resulting in a debit balance. Unadjusted, inventory and COGS are understated and operating income is overstated.

The treatment of this difference depends on its materiality:

The difference is not material The difference is typically closed directly to the cost of goods sold account. Using the below journal entries:

The difference is material The difference should be allocated proportionally across work-in-process (WIP), finished goods (FG), and COGS. The preferred basis is the applied overhead included in each account’s ending balance; an alternative is each account’s total ending balance.

Example: Prorating underapplied overhead

Actual overhead for the period is $620,000 and applied overhead is $600,000, so overhead is underapplied by $20,000. Applied overhead included in the ending balances of WIP, FG, and COGS is $60,000, $90,000, and $450,000, respectively - a total of $600,000.

  • WIP’s share: 600,00060,000​×20,000=2,000
  • FG’s share: 600,00090,000​×20,000=3,000
  • COGS’s share: 600,000450,000​×20,000=15,000

Answer: Debit MOH applied $600,000, debit WIP $2,000, debit FG $3,000, and debit COGS $15,000; credit MOH control $620,000. This closes both accounts and clears the $20,000 underapplied balance. (With a single manufacturing overhead account, the entry is the three debits and a $20,000 credit to manufacturing overhead.)

Summary: overhead application and adjustment flow

  1. Overhead is applied to WIP using a predetermined rate.
  2. Actual overhead is incurred and recorded separately.
  3. The difference (if any) results in over- or underapplied overhead.
  4. This difference is either: closed to COGS (for immaterial balances), or prorated among WIP, FG, and COGS (for material balances).

Activity-based overhead allocation

While traditional overhead allocation methods (e.g., corporate-wide or departmental rates) apply overhead using a single or limited number of allocation bases, activity-based costing (ABC) offers a more refined and accurate approach. In ABC, overhead costs are traced to activities, then assigned to products or services based on their actual consumption of those activities.

Since a comprehensive discussion of ABC is already provided in the activity-based costing section of this textbook, you are encouraged to refer to that section for the following topics:

  • The rationale and strategic value of ABC
  • Key elements: cost pool, cost driver, resource driver, activity driver, and value-added activity
  • Calculation of overhead using ABC
  • Comparison of ABC to traditional overhead systems
  • Practical applications and limitations

In summary, ABC is especially useful when overhead costs are high and diverse, and when multiple products or services consume activities at different rates. It supports better decision-making in pricing, product design, and cost control.

Key points

Overhead application journal entries

  • Actual overhead (utilities, depreciation, indirect materials) recorded in manufacturing overhead control account
  • Applied overhead (predetermined rate × actual activity) recorded in manufacturing overhead applied account
  • Ideally these two accounts net to zero; differences are the norm

Causes and types of over/underapplied overhead

  • Applied overhead = predetermined rate × actual activity; gaps arise from spending differing from budget or actual activity differing from the rate’s denominator level (main driver for fixed overhead)
  • Overapplied: Applied > Actual → credit balance; unadjusted, inventory/COGS overstated, operating income understated
  • Underapplied: Applied < Actual → debit balance; unadjusted, inventory/COGS understated, operating income overstated
  • A recurring imbalance in the same direction signals the predetermined rate needs revision

Treatment of the difference: immaterial vs. material

  • Immaterial: closed entirely to Cost of Goods Sold (COGS)
  • Material: prorated across WIP, Finished Goods (FG), and COGS
    • Preferred basis: applied overhead included in each account’s ending balance
    • Alternative basis: each account’s total ending balance
  • Proration formula: account’s share=total applied overheadaccount’s applied overhead​×over/underapplied amount
  • Example: $20,000 underapplied prorated using $600,000 total applied overhead → WIP $2,000, FG $3,000, COGS $15,000 (debits), closing both overhead accounts

Activity-based costing (ABC) overview

  • Traces overhead to activities first, then assigns to products based on actual consumption (vs. single/limited traditional allocation bases)
  • Key elements: cost pool, cost driver, resource driver, activity driver, value-added activity
  • Most useful when overhead is high/diverse and products consume activities at different rates; improves pricing, product design, and cost control decisions

More from Overhead costs

  • Overhead classification and cost behavior
  • Overhead allocation methods
  • Allocation of service department costs: overview
  • Allocation of service department costs: direct method
  • Allocation of service department costs: step-down method