



The flexible budget variance
We can use the following general formula as guidance:
This calculation is applied to all key line items, including revenues, variable costs, fixed costs, and operating profit. Since the quantities are constant between the actual results and the flexible budget, managers can isolate variances attributable to factors such as price changes, efficiency, and cost control. These variances provide insight into operational efficiency, pricing strategies, and cost management, helping managers pinpoint areas requiring attention.
For revenue, the flexible budget variance equals the sales price variance. For each variable cost, it’s the sum of the price (rate) variance and the efficiency (usage) variance - those components are covered in the materials, labor, and overhead variance chapters.
Flexible budget variance analysis
We already discussed the flexible budget variance in the earlier chapter, which covered a simplified scenario where only sales and production volume changed while prices stayed constant. This section extends that analysis to a case where volume, sales prices, and input prices all differ from budget.
Example analysis
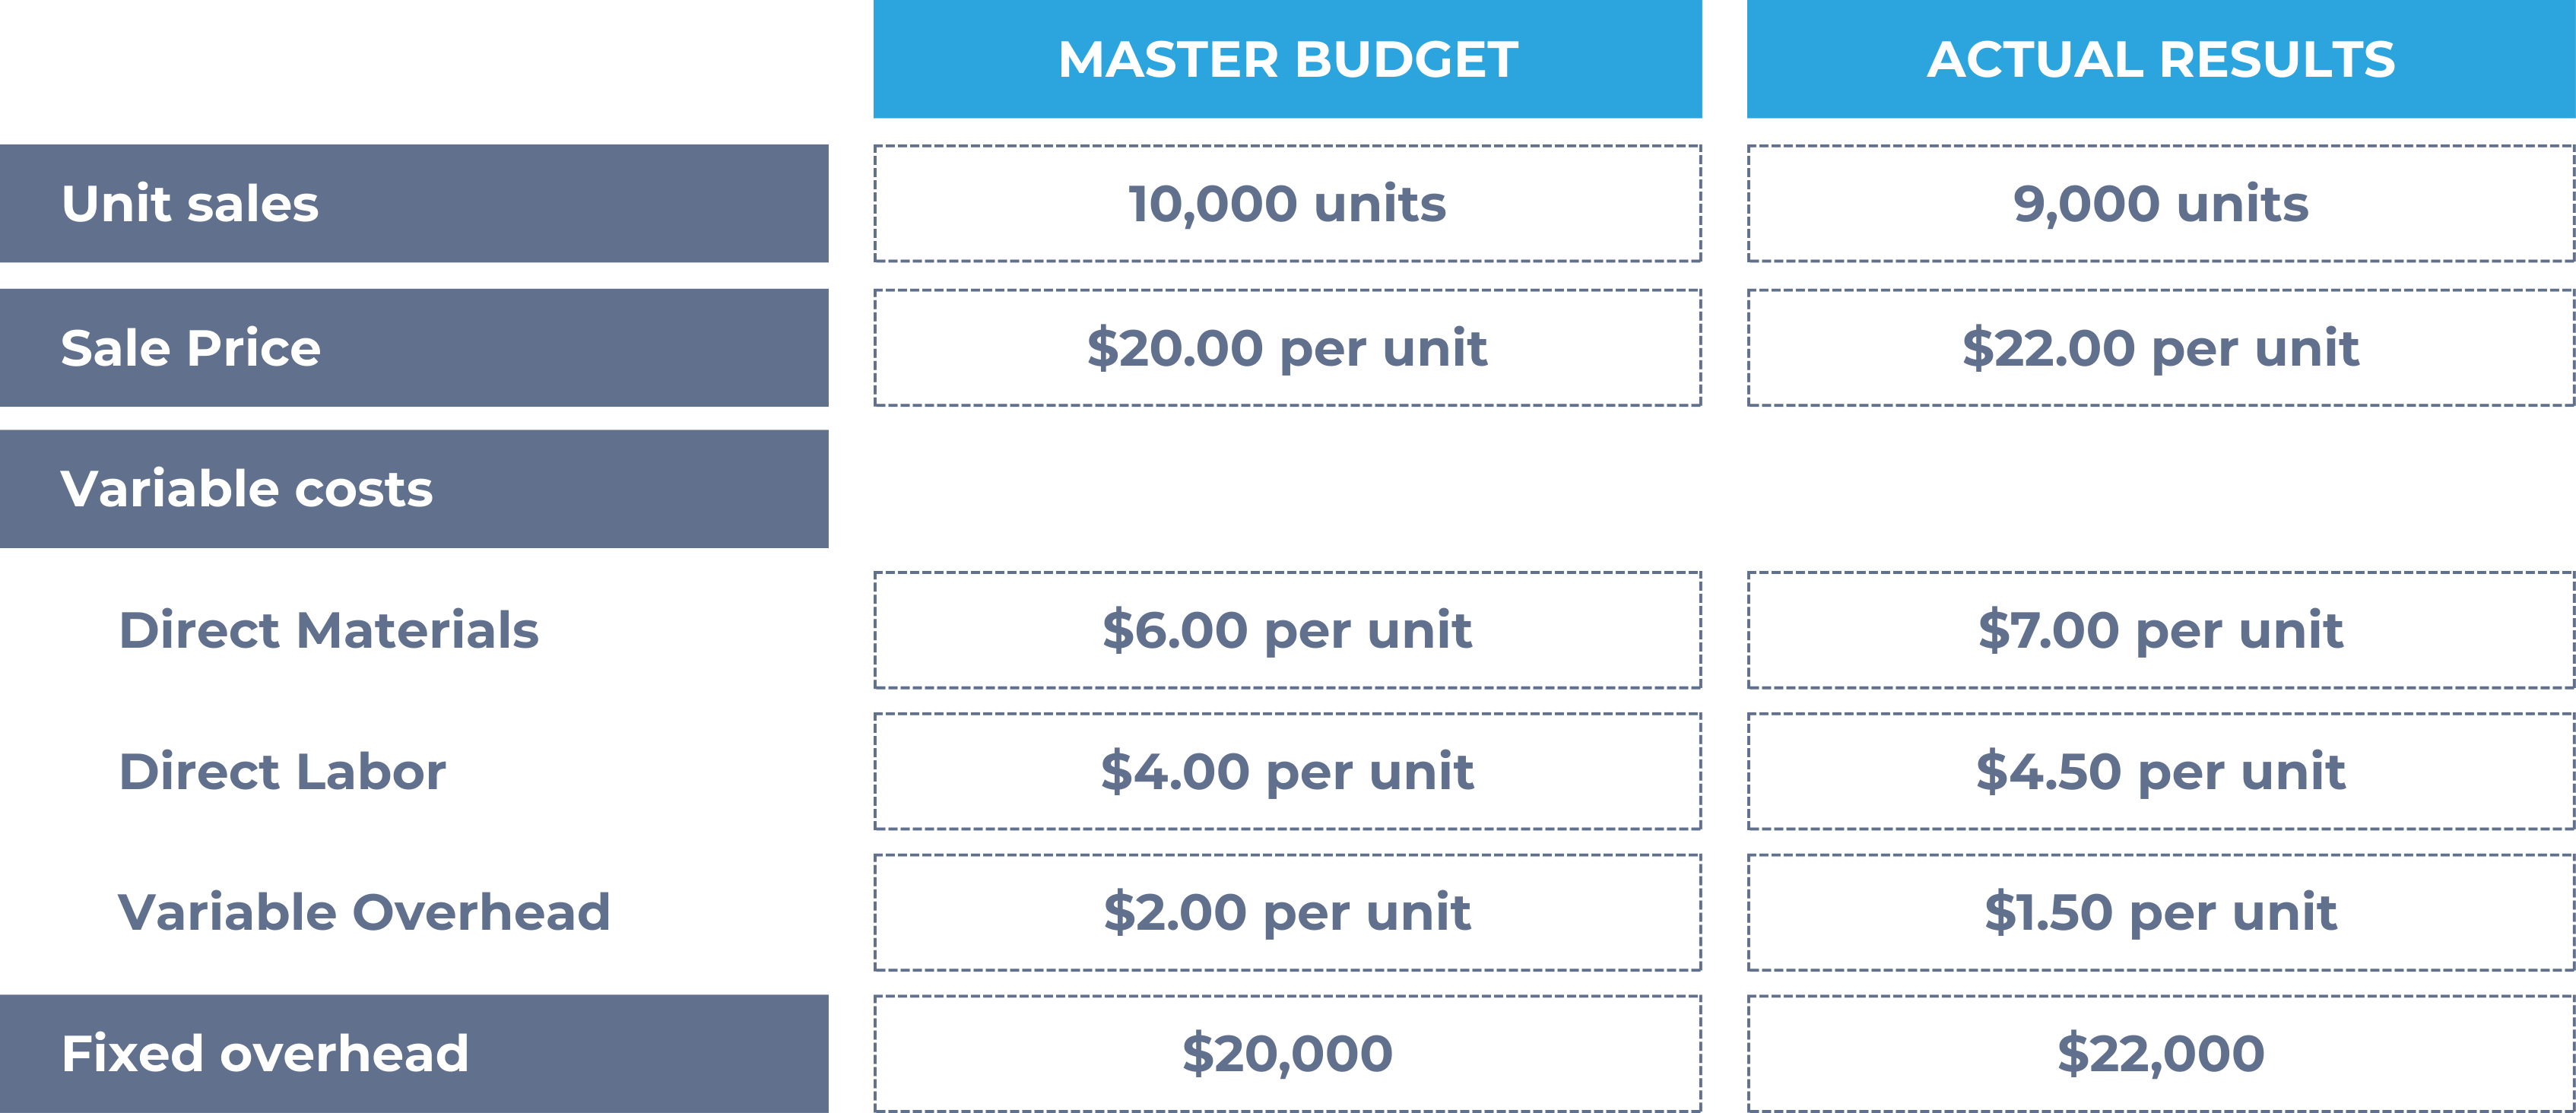
Consider the following example company that has the following budgeted and actual results:
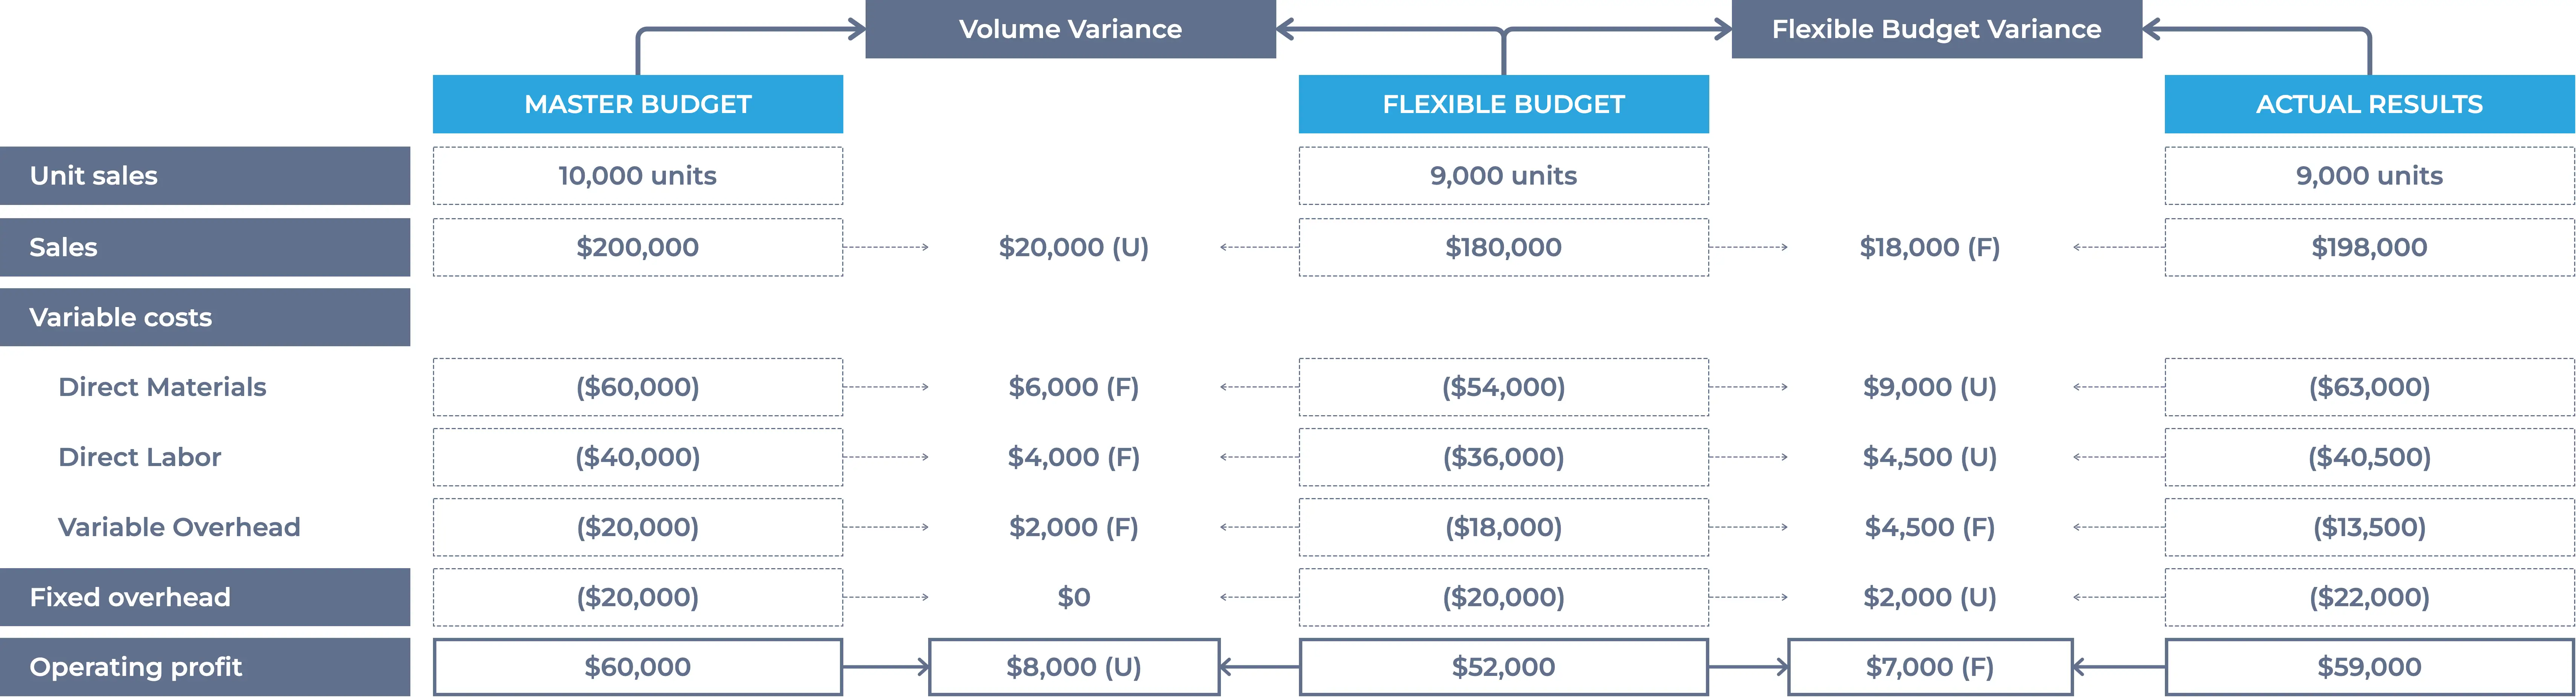
We can prepare the flexible budget by adjusting the master budget of the actual units sold (9,000). We can then examine the flexible budget variance by comparing the actual results to the flexible budget.
The table below lays out the static budget, flexible budget, and actual figures used throughout this analysis, so the arithmetic in each subsection can be traced back to its source numbers:
| Line item | Static budget (10,000 units) | Flexible budget (9,000 units) | Actual (9,000 units) |
|---|---|---|---|
| Sales price per unit | $20 | $20 | $22 |
| Revenue | $200,000 | $180,000 | $198,000 |
| Direct materials cost per unit | $6 | $6 | $7 |
| Direct materials | $60,000 | $54,000 | $63,000 |
| Direct labor cost per unit | $4 | $4 | $4.50 |
| Direct labor | $40,000 | $36,000 | $40,500 |
| Variable overhead cost per unit | $2 | $2 | $1.50 |
| Variable overhead | $20,000 | $18,000 | $13,500 |
| Fixed overhead | $20,000 | $20,000 | $22,000 |
| Operating profit | $60,000 | $52,000 | $59,000 |
The analysis shows a total flexible budget variance of $7,000 favorable based on operating profit. While this figure indicates that actual performance was slightly better than expected overall, it does not provide meaningful insight on its own. The total variance must be broken down into its individual components, such as revenue, direct materials, direct labor, and overhead, in order to understand the underlying reasons for the difference.
1. Revenue variances
The revenue flexible budget variance is $198,000 − $180,000 = $18,000 favorable, driven by the actual sales price of $22 per unit exceeding the budgeted price of $20 per unit. This is the same calculation as the sales price variance.
The $20,000 unfavorable sales volume variance (flexible budget revenue of $180,000 minus static budget revenue of $200,000, from selling 9,000 units instead of the budgeted 10,000) is not part of the flexible budget variance - it explains the rest of the $2,000 unfavorable static-budget revenue variance ($18,000 F − $20,000 U = $2,000 U).
For further insight into these variances, see the upcoming sales variance chapters.
2. Direct material flexible budget variance
The flexible budget variance for direct materials is $9,000 (U), indicating that the company spent more on materials than expected based on the actual production volume.
The flexible budget cost for direct materials was $54,000 (9,000 units × $6 per unit), while the actual cost was $63,000 (9,000 units × $7 per unit). This means the company spent $1 more per unit than budgeted, resulting in the unfavorable variance.
3. Direct labor flexible budget variance
The flexible budget variance for direct labor is $4,500 (U), reflecting higher-than-expected labor costs.
Based on the flexible budget, direct labor costs were expected to be $36,000 (9,000 units × $4 per unit), but actual costs amounted to $40,500 (9,000 units × $4.50 per unit). This variance indicates that the company spent $0.50 more per unit on labor than planned, resulting in higher overall costs for the actual production volume.
4. Variable overhead flexible budget variance
The flexible budget variance for variable overhead is $4,500 (F), indicating that actual variable overhead costs were lower than expected based on the actual production volume.
The flexible budget allocated $18,000 for variable overhead (9,000 units × $2 per unit), but actual costs were only $13,500 (9,000 units × $1.50 per unit). This favorable variance reflects savings of $0.50 per unit, reducing overall costs compared to the budgeted amount.
The table below summarizes typical causes behind these kinds of cost variances:
| Line item | Typical price/rate drivers | Typical efficiency/usage drivers |
|---|---|---|
| Direct materials | Market price changes, supplier contract terms, choice of higher-quality materials | Waste, scrap, inefficient handling |
| Direct labor | Wage rate changes, overtime premiums, labor market conditions | Productivity levels, training, supervision |
| Variable overhead | Utility rates, indirect material prices | Machine run time, resource efficiency |
5. Fixed overhead flexible budget variance
The flexible budget variance for fixed overhead is $2,000 (U). Because fixed costs are assumed not to change with production volume, the flexible budget holds fixed overhead at the budgeted amount of $20,000 - the same figure used in the static budget. The variance is simply actual fixed overhead minus the flexible budget amount: $22,000 − $20,000 = $2,000 unfavorable.
For fixed overhead, this flexible budget variance is the same thing as the fixed overhead spending variance - since volume doesn’t affect the flexible budget amount, there’s no separate efficiency component to isolate here. A related measure, the production volume variance, compares the flexible budget to overhead applied to production; it’s covered in a later chapter.
The flexible budget variance removes the effect of volume by comparing actual results to a budget flexed to actual output, so it reflects differences in prices, efficiency, and spending - not volume. The effect of actual volume differing from the planned (static budget) volume shows up instead in the sales volume variance.