


Achievable logoAchievable logo
CGMA BA1
Sign in
Sign up
Purchase
Textbook
Practice exams
Support
How it works
Exam catalog
Mountain with a flag at the peak
Textbook
Introduction
1. Goals and decisions of an organization
2. The market system
3. The domestic economy
4. Macroeconomics – The international economy
5. Macroeconomics – Index numbers
5.1 Introduction
5.2 Index numbers
5.3 Relative indices
6. Introduction to the financial context of business entities
7. Foreign currencies
8. Investment appraisal
9. Summarizing and analyzing data
10. Inter-relationships between variables
11. Time series model
Wrapping up
Achievable logoAchievable logo
5.3 Relative indices
CGMA BA1
5. Macroeconomics – Index numbers
Our CGMA course is currently in development and is a work-in-progress.

Relative indices

5 min read
Font
Discuss
Share
Feedback

In this part of the chapter, the focus is on relative indices, specifically:

  • Relative price index
  • Relative quantity index

Relative price indices

Relative price indices measure how prices have moved from the base year to the current year. They do this by first calculating a relative price for each product and then combining those relatives using weights.

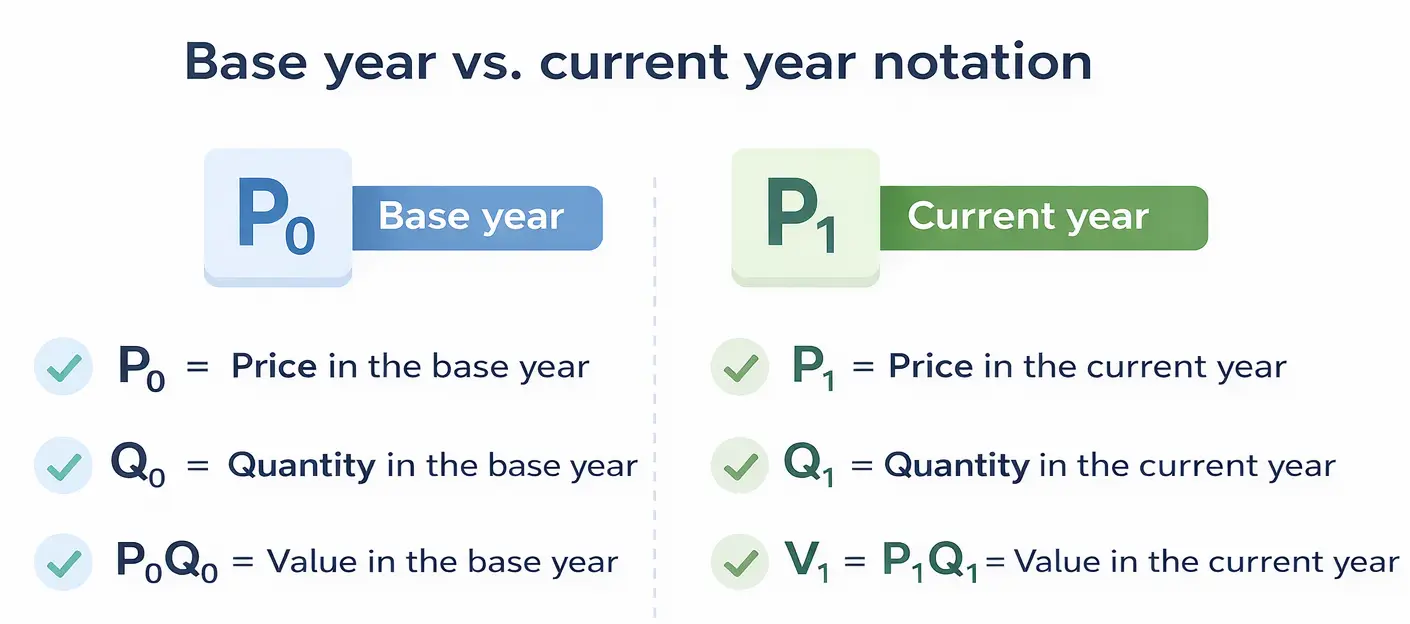
Before you start calculating, make sure you can recognize the signs and labels used in the tables.

(image needed)

Key signs and features necessary on the calculation on the relative indices
Index number signs

The formulas for the relative price indices are:

Weighted by quantity

(Σ(Rel × Q₀) / ΣQ₀) × 100

Weighted by value

(Σ(Rel × Vo) / ΣVo) × 100

In these formulas:

  • Rel is the relative price for each product, calculated as P1/P0.
  • Q₀ is the base-year quantity.
  • V0 (written as Vo in the formula) is the base-year value, calculated as Q0 × P0.

Let’s work through an example to see how the formulas are applied.

Year 2020 2020 2024 2024
Price Quantity Price Quantity
Product A 18 100 24 249
Product B 17 165 22 280
Product C 15 185 18 348
Product D 12 200 14 300

Calculate the base weighted relative price index using weights of:

  1. Quantities
  2. Value (in our case, revenue)

Here, the base year is 2020 and the current year is 2024.

Solution

First, calculate the components needed for the formulas.

REL Price Base year Quantity Base year value (V0) REL X Q0 REL X V0
P1/P0 Q0 Q0 X P0
Product A 1,33 100 1800 133,33 2400
Product B 1,29 165 2805 213,53 3630
Product C 1,2 185 2775 222 3330
Product D 1,17 200 2400 233,33 2800
650 9780 802,20 12160

Based on quantities

Use the quantity-weighted formula:

Σ(Rel × Q₀) / ΣQ₀) × 100

Calculations

650802,20​×100

=123,41

Explanations The table provides the two totals you need:

  • Σ(Rel × Q₀) = 802,20
  • ΣQ₀ = 650

Substitute these totals into the formula and multiply by 100 to convert the result into an index.

Based on value

Use the value-weighted formula:

(Σ(Rel × Vo) / ΣVo) × 100

Calculations

978012160​×100

=124,34

Explanations Again, the table provides the totals used in the formula:

  • Σ(Rel × V0) = 12160
  • ΣV0 = 9780

Substitute these totals into the formula and multiply by 100.

In an exam, use the weighting method the question asks for (either quantity weights or value weights).

Sometimes you’ll be asked to use current-year weights instead of base-year weights. In that case, you must rebuild the table using current-year quantities or values.

The next example shows the same idea using current weightings (2024).

REL Price Current Yr Value (V1) REL X Q1 REL X V1
P1/P0 Q1 Q1 X P1
Product A 1,33 249 5976 332 7968
Product B 1,29 280 6160 362,35 7971,76
Product C 1,2 348 6264 417,6 7516,8
Product D 1,17 300 4200 350 4900
1177 22600 1461,9529 28356,56

Based on current quantities

(Σ(Rel × Qᵢ) / ΣQᵢ) × 100

Calculations

11771461,95​×100

=124,21

Current values

(Σ(Rel × Vᵢ) / ΣVᵢ) × 100

Calculations

2260028356,56​×100

=125,47

Quantity indices

Instead of measuring change using prices, you can measure change using the quantities purchased over time.

For quantity indices, the weights are prices. Use the following formula:

( Σ( W × (Qᵢ / Q₀) ) / ΣW ) × 100

Let’s use an example to see how the formula works.

2020 2024
Quantity Quantity Weights
Product A 25 34 77
Product B 30 39 67
Product C 45 53 85

Using 2020 as the base year, calculate the relative quantity indices.

Solution

Q1/Q0 W W x (Q1/Q0)
Product A 1,36 77 104,72
Product B 1,3 67 87,1
Product C 1,18 85 100,11
229 291,93

Calculations

The formula is shown above:

Calculations

229291,93​×100

=127,48

Choice of weightings, either current or base weightings

  • The current weightings are more up to date, which makes them preferable; however, they are not readily available since you will have to wait until the end of the year for them to be fully produced or earlier the following year to be more realistic.
  • Base weighted indices are readily available, which should speed up the process. However, we should note that the base weightings are not up to date, and as a result, they may exaggerate inflation during calculations.
  • Obtaining current weights is costly than using the base weights because of the reasons mentioned in the first point.
  • The current weightings are more difficult to compare year by year since they may change due to new items being added into the basket.

Index numbers can be used to calculate inflation movements as below:

Yamal receives a salary of $100 000 per year, and his salary is index-linked. The inflation index at the beginning of 2024 was 240 (end of 2023) and 300 at the end of 2024. Calculate Yamal’s salary increase based on the inflation index.

Solution

First, rebase the inflation index to the beginning of the year. That rebased starting point becomes 100.

Year 2023 2024
Inflation Index 260 300
Rebased to 2023 100 115,38

Calculations

$100000×1,15

=$115384,6

−$100000

=$15384,62

Relative price indices

  • Measure price changes from base year to current year
  • Two main weighting methods:
    • Quantity weights: (Σ(Rel × Q₀) / ΣQ₀) × 100
    • Value weights: (Σ(Rel × V₀) / ΣV₀) × 100
  • Relative price (Rel) = P₁ / P₀
    • Q₀ = base-year quantity; V₀ = Q₀ × P₀ (base-year value)
  • Can use base-year or current-year weights depending on question

Relative price index calculation steps

  • Calculate Rel for each product (P₁ / P₀)
  • Multiply Rel by weights (Q₀ or V₀)
  • Sum products and divide by sum of weights, then × 100
  • Example results:
    • Base-year quantity weights: 123.41
    • Base-year value weights: 124.34
    • Current-year quantity weights: 124.21
    • Current-year value weights: 125.47

Quantity indices

  • Measure change in quantities purchased over time
  • Weights are prices (usually from base year)
  • Formula: (Σ(W × (Q₁ / Q₀)) / ΣW) × 100
    • W = price weight, Q₀ = base-year quantity, Q₁ = current-year quantity
  • Example result: 127.48

Choice of weightings

  • Current weights: more accurate, but less available and costly to obtain
  • Base weights: readily available, may exaggerate inflation, easier comparison
  • Current weights can change due to new items, making year-to-year comparison harder

Index numbers and inflation adjustments

  • Used to calculate salary or price increases due to inflation
  • Rebase index to starting point (set base year index to 100)
  • Salary adjustment formula: New Salary = Old Salary × (New Index / Old Index)
    • Example: $100,000 × 1.15 = $115,384.62 (increase of $15,384.62)

Sign up for free to take 5 quiz questions on this topic

Previous
Next  | 6.1 Financial markets
All rights reserved ©2016 - 2026 Achievable, Inc.

Relative indices

In this part of the chapter, the focus is on relative indices, specifically:

  • Relative price index
  • Relative quantity index

Relative price indices

Relative price indices measure how prices have moved from the base year to the current year. They do this by first calculating a relative price for each product and then combining those relatives using weights.

Before you start calculating, make sure you can recognize the signs and labels used in the tables.

(image needed)

The formulas for the relative price indices are:

Weighted by quantity

(Σ(Rel × Q₀) / ΣQ₀) × 100

Weighted by value

(Σ(Rel × Vo) / ΣVo) × 100

In these formulas:

  • Rel is the relative price for each product, calculated as P1/P0.
  • Q₀ is the base-year quantity.
  • V0 (written as Vo in the formula) is the base-year value, calculated as Q0 × P0.

Let’s work through an example to see how the formulas are applied.

Year 2020 2020 2024 2024
Price Quantity Price Quantity
Product A 18 100 24 249
Product B 17 165 22 280
Product C 15 185 18 348
Product D 12 200 14 300

Calculate the base weighted relative price index using weights of:

  1. Quantities
  2. Value (in our case, revenue)

Here, the base year is 2020 and the current year is 2024.

Solution

First, calculate the components needed for the formulas.

REL Price Base year Quantity Base year value (V0) REL X Q0 REL X V0
P1/P0 Q0 Q0 X P0
Product A 1,33 100 1800 133,33 2400
Product B 1,29 165 2805 213,53 3630
Product C 1,2 185 2775 222 3330
Product D 1,17 200 2400 233,33 2800
650 9780 802,20 12160

Based on quantities

Use the quantity-weighted formula:

Σ(Rel × Q₀) / ΣQ₀) × 100

Calculations

650802,20​×100

=123,41

Explanations The table provides the two totals you need:

  • Σ(Rel × Q₀) = 802,20
  • ΣQ₀ = 650

Substitute these totals into the formula and multiply by 100 to convert the result into an index.

Based on value

Use the value-weighted formula:

(Σ(Rel × Vo) / ΣVo) × 100

Calculations

978012160​×100

=124,34

Explanations Again, the table provides the totals used in the formula:

  • Σ(Rel × V0) = 12160
  • ΣV0 = 9780

Substitute these totals into the formula and multiply by 100.

In an exam, use the weighting method the question asks for (either quantity weights or value weights).

Sometimes you’ll be asked to use current-year weights instead of base-year weights. In that case, you must rebuild the table using current-year quantities or values.

The next example shows the same idea using current weightings (2024).

REL Price Current Yr Value (V1) REL X Q1 REL X V1
P1/P0 Q1 Q1 X P1
Product A 1,33 249 5976 332 7968
Product B 1,29 280 6160 362,35 7971,76
Product C 1,2 348 6264 417,6 7516,8
Product D 1,17 300 4200 350 4900
1177 22600 1461,9529 28356,56

Based on current quantities

(Σ(Rel × Qᵢ) / ΣQᵢ) × 100

Calculations

11771461,95​×100

=124,21

Current values

(Σ(Rel × Vᵢ) / ΣVᵢ) × 100

Calculations

2260028356,56​×100

=125,47

Quantity indices

Instead of measuring change using prices, you can measure change using the quantities purchased over time.

For quantity indices, the weights are prices. Use the following formula:

( Σ( W × (Qᵢ / Q₀) ) / ΣW ) × 100

Let’s use an example to see how the formula works.

2020 2024
Quantity Quantity Weights
Product A 25 34 77
Product B 30 39 67
Product C 45 53 85

Using 2020 as the base year, calculate the relative quantity indices.

Solution

Q1/Q0 W W x (Q1/Q0)
Product A 1,36 77 104,72
Product B 1,3 67 87,1
Product C 1,18 85 100,11
229 291,93

Calculations

The formula is shown above:

Calculations

229291,93​×100

=127,48

Choice of weightings, either current or base weightings

  • The current weightings are more up to date, which makes them preferable; however, they are not readily available since you will have to wait until the end of the year for them to be fully produced or earlier the following year to be more realistic.
  • Base weighted indices are readily available, which should speed up the process. However, we should note that the base weightings are not up to date, and as a result, they may exaggerate inflation during calculations.
  • Obtaining current weights is costly than using the base weights because of the reasons mentioned in the first point.
  • The current weightings are more difficult to compare year by year since they may change due to new items being added into the basket.

Index numbers can be used to calculate inflation movements as below:

Yamal receives a salary of $100 000 per year, and his salary is index-linked. The inflation index at the beginning of 2024 was 240 (end of 2023) and 300 at the end of 2024. Calculate Yamal’s salary increase based on the inflation index.

Solution

First, rebase the inflation index to the beginning of the year. That rebased starting point becomes 100.

Year 2023 2024
Inflation Index 260 300
Rebased to 2023 100 115,38

Calculations

$100000×1,15

=$115384,6

−$100000

=$15384,62

Key points

Relative price indices

  • Measure price changes from base year to current year
  • Two main weighting methods:
    • Quantity weights: (Σ(Rel × Q₀) / ΣQ₀) × 100
    • Value weights: (Σ(Rel × V₀) / ΣV₀) × 100
  • Relative price (Rel) = P₁ / P₀
    • Q₀ = base-year quantity; V₀ = Q₀ × P₀ (base-year value)
  • Can use base-year or current-year weights depending on question

Relative price index calculation steps

  • Calculate Rel for each product (P₁ / P₀)
  • Multiply Rel by weights (Q₀ or V₀)
  • Sum products and divide by sum of weights, then × 100
  • Example results:
    • Base-year quantity weights: 123.41
    • Base-year value weights: 124.34
    • Current-year quantity weights: 124.21
    • Current-year value weights: 125.47

Quantity indices

  • Measure change in quantities purchased over time
  • Weights are prices (usually from base year)
  • Formula: (Σ(W × (Q₁ / Q₀)) / ΣW) × 100
    • W = price weight, Q₀ = base-year quantity, Q₁ = current-year quantity
  • Example result: 127.48

Choice of weightings

  • Current weights: more accurate, but less available and costly to obtain
  • Base weights: readily available, may exaggerate inflation, easier comparison
  • Current weights can change due to new items, making year-to-year comparison harder

Index numbers and inflation adjustments

  • Used to calculate salary or price increases due to inflation
  • Rebase index to starting point (set base year index to 100)
  • Salary adjustment formula: New Salary = Old Salary × (New Index / Old Index)
    • Example: $100,000 × 1.15 = $115,384.62 (increase of $15,384.62)

More from Macroeconomics – Index numbers

  • Introduction
  • Index numbers