Mean, Median, and Standard Deviation
Introduction
The title of this chapter points to the three most frequent statistical measures tested on the SAT: mean, median, and standard deviation. However, the SAT will also occasionally address mode as well as range, so those two values are included and defined here as well. Often, a question will relate two or more of these five quantities in the same question; for example, a question could ask whether the mean or the median is larger in a certain data set. Finally, keep an eye out for the box plot, a somewhat unusual statistical measure that will be covered in this lesson because it relates especially to median and range.
Approach Question
A group of 30 sports fans tests their fandom by cataloguing how many hats each owns with professional sports team logos. The following table shows the results:
Number of Hats Frequency 5 1 8 6 9 8 11 3 12 7 15 5 Which of the following correctly orders the mean, median, and mode of this data?
A. mean < median < mode
B. median < mode < mean
C. mode < mean < median
D. mode < median < mean
Explanation
We start by defining the meaning of each of the “three statistical M’s”. Students are often most familiar with the mean, though they often know it as the average: the sum of all given values divided by the number of values. The calculator makes the average (mean) calculation fairly straightforward.
The median, meanwhile, is the middle number when the numbers are listed in order from least to greatest. If an unordered list of numbers is provided, therefore, the first step in finding the median is to order the numbers in sequence. In this case, the numbers are given in order, but a different wrinkle is introduced: frequency. A frequency table lists numbers by how many times they appear; in this case, we can infer that only one person has exactly 5 hats, while, at the other extreme, eight people have exactly 9 hats.
Finally, the mode is the number that appears the most, and therefore the easiest to identify in this case: the mode is 9. Note that it is possible to have multiple modes: if this case introduced different numbers of hats that each characterized exactly 8 people, then in that case, there would have been multiple modes.
Now that we know the mode is 9, we can use a calculator to find the mean. Don’t forget to multiply each number of hats by the frequency with which it appears! The sum of all hats, therefore, is . Dividing by our total of hat owners gives us a mean of approximately . So the mean is greater than the mode in this case.
What about the median? This question invokes the trickiest issue regarding the median: what if there is an even number of numbers, and therefore no middle number? In that case, we take the mean of the two middle numbers. If you add the numbers on the frequency side of the table, starting at the top, you’ll note that people have hats, while people have hats. This means that the middle of the distribution must be exactly halfway between and . So the median is , which is greater than the mode but smaller than the mean. Thus our answer: mode<median<mean.
Topics for Cross-Reference
Variations
The main variation you will find in questions about statistical values has to do with how they are presented: in this lesson, you will see tables, dot plots, and box plots. A later lesson will introduce scatterplots, line graphs, bar graphs, and histograms.
Flashcard Fodder
- Do you need to put the formula for mean (average) on a flashcard? Please do so if needed: mean = sum/number.
- It wouldn’t hurt to create flashcards from the other definitions given in this lesson.
Sample Questions
Difficulty 1
A group of six students stands in a line from shortest to tallest; a seventh student measures the height of the shortest student and that of the tallest student. Which of the following values can be calculated from these measurements?
A. The mean height of the six students
B. The median height of the six students
C. The range in heights of the six students
D. The standard deviation of the heights of the six students
The answer is the range in heights of the six students. This question is about definitions. The Approach question reoriented you to mean and median and when they can be found. Ask yourself: could either of them be found if you only knew the smallest and largest values in a list? Certainly not.
That leaves range and standard deviation. Our definitions section reminds you that standard deviation measures how “spread out” the data are from the mean. But to know this, we have to know all the data points. Here, we are only given two of the six. But range we can find, since range is simply the largest value minus the smallest.
Difficulty 2
In his chemistry lab, Josh determined that a molecule of water weighs grams per mole, a molecule of hydrochloric acid weighs grams per mole, and a molecule of ammonia weighs grams per mole (all rounded to the nearest tenth). If Josh’s calculations are correct, what is the average weight, in grams per mole, of these three molecules, rounded to the nearest tenth? (Note: this is a free-response question.)
The answer is 23.8. Thank goodness for the calculator! This problem is straightforward if you know how to calculate an average using the calculator … except for the rounding part. The sum of Josh’s three values is ; we divide that by the number of values, , and the calculator shows . Normally, in a free-response question on the SAT, you would enter exactly that, because that would occupy the five allowable digits. But this problem is a reminder of what the UnCLES method says: read the question itself very carefully, and make a note of it! We are supposed to round to the nearest tenth, so the last digit is dropped.
Difficulty 3
In a set of nine different integers, the fourth-smallest integer is doubled. Which of the following must change as a result of this doubling?
I. Mean
II. Median
III. ModeA. I only
B. I and III only
C. II and III only
D. None of the above must change.
The answer is I only. To answer this challenging question, we need to keep our sights on the word “must”; any of the statistical values that do not have to change can be eliminated. Starting with the mean, or average, we find perhaps the most straightforward conclusion: doubling one of the numbers must change the mean because it changes the sum. As long as the number of elements in the set doesn’t change, the mean will be larger. Before we continue, note that we can already eliminate two answer choices because statement I is true. Interestingly, we don’t even have to test the median, because the only thing we need to distinguish between choices A and B is a conclusion about the mode!
To address the mode, we recall that the mode is the value that appears the most in a list. In this question, each number is different, so each number is evenly the mode. If doubling the fourth-lowest number makes the result the same as another number in the list, then the mode would change: the number that appears twice would be the new mode. The problem is that we don’t know whether doubling the fourth-smallest number makes it equal to another number or not. Since we can’t know for sure, we eliminate statement III and therefore the remaining wrong answer as well.
If you’re curious about why statement II doesn’t have to be true (the inevitable conclusion, since there’s only one answer choice left!), consider this: we know that the fifth number in this list would be the median since it’s the middle of nine numbers. The number we’re doubling is just one before the median in order. So wouldn’t the median change because the fourth-smallest number would hop over the fifth number in value when doubled? We don’t know that for sure because there could be a large gap between the fourth and fifth numbers. For example, if the fourth-smallest number was and the median was , doubling the fourth-lowest number would still leave it smaller than the median, so the median wouldn’t change.
Difficulty 4
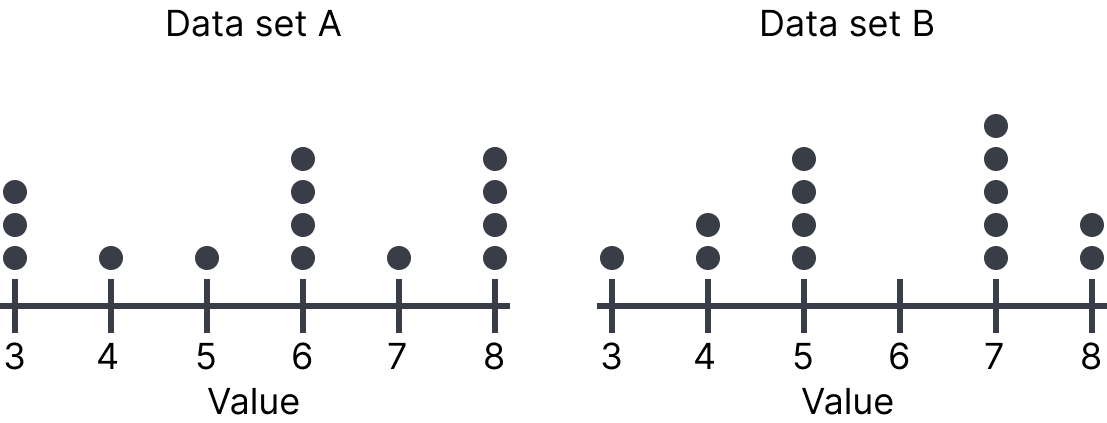
The dot plots represent the distribution of values in data sets A and B.
Which of the following statements must be true?
I. The median of data set A is equal to the median of data set B.
II. The standard deviation of data set A is equal to the standard deviation of data set B.A. I only
B. II only
C. Both I and II
D. Neither I nor II
The answer is I only. To start with the second statement first, note in the definition of standard deviation given above that you will not have to calculate it on the SAT. This means that you can address statement II by observation. Do the points appear equally spread out from the middle? Clearly not; in set A, many of the values are located at the extremes, while this is less true in set B. The standard deviations are not equal, which means we eliminate the two answer choices that include statement II.
Now let’s address the median, which will take more analysis. We could create a list of the two sets of values from least to greatest by counting the dots at each value. So, for example, data set A would begin , , , … It may be a quicker, however, to note that both data sets have values (count the dots to check!) and to think critically about where the median in a list of values is found.
As with the Approach question, we have an even number of values, so the median must be halfway between two of the values. Which two? We can figure that out by splitting the data exactly in half; seven values would be below the median and seven above it. This means the median must be halfway between the seventh and eighth values. Starting on the left, we can count the number of dots. In data set A, both the seventh and the eighth values are . In data set , the seventh value is and the eighth value is ; halfway between these two is … also ! The two medians are equal.
Difficulty 5
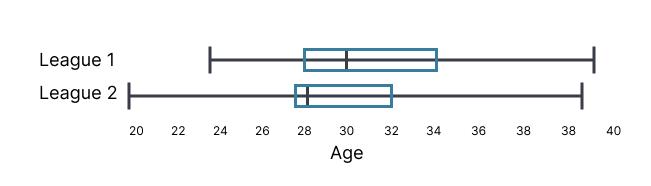
The two box plots show the distribution of ages in two adult soccer leagues. Which of the following is false?
A. The median age of League 1 is older than the median age of League 2.
B. The youngest player in League 1 is older than the youngest player in League 2.
C. The range of ages in League 1 is greater than the range of ages in League 2.
D. The interquartile range of League 1 is older than the interquartile range of League 2.
The answer is The range of ages in League 1 is greater than the range of ages in League 2.. The question is included in Difficulty 5 not because it is blindly hard, but because a box plot (also known as a “box-and-whisker plot”) will be unfamiliar to many students. The virtue of a box plot is that it can visually demonstrate relationships between quartiles (fourths) of the data. For example, if there are data points, then each quartile contains points.
Take a look at the diagram below. The plot extends from the smallest value to the largest, which means we can find the range by subtracting the smallest from the largest. But we also get something called the interquartile range, which is the range of data from 25th percentile to the 75th percentile. In other words, exactly half of the data (the half in the middle) is within the interquartile range, and half of the data is outside of it. Note, further, that the four quartiles shown (two inside the “box” and two outside) are not of equal length. This shows us that some quartiles (fourths) of the data are more spread out than others; put another way, some have larger ranges within themselves than others do.
Let’s use the plots of soccer player ages to answer the question. We know we can find the range of both values; the range of A appears to be 16 (23 to 39), while the range of B is 18 (20 to 38). It appears we have already found the false statement, and therefore our answer! But let’s confirm the truth of the other statements. We can readily observe the data set A’s youngest player (age 23) is older than set B’s youngest (20). For the medians, remember that the line inside the box identifies the median; clearly, set A’s is greater as it is further to the right. Finally, the interquartile ranges can be compared somewhat easily because they begin at the same value (27); since set A’s stretches further to the right, it is larger. We have confirmed our answer.