Achievable logoAchievable logo
Series 65
Sign in
Sign up
Purchase
Textbook
Practice exams
Support
How it works
Resources
Exam catalog
Mountain with a flag at the peak
Textbook
Introduction
1. Investment vehicle characteristics
2. Recommendations & strategies
3. Economic factors & business information
3.1 Basic economic concepts
3.1.1 Monetary policy
3.1.2 Rates
3.1.3 Federal Reserve tools
3.1.4 Economic factors
3.1.5 Indicators and market structure
3.1.6 Fiscal policy
3.2 Financial reporting
3.3 Analytical methods
3.4 Descriptive statistics
3.5 Systematic risks
3.6 Non-systematic risks
4. Laws & regulations
Wrapping up
Achievable logoAchievable logo
3.1.4 Economic factors
Achievable Series 65
3. Economic factors & business information
3.1. Basic economic concepts

Economic factors

11 min read
Font
Discuss
Share
Feedback

The Federal Reserve’s dual mandate requires it to focus on encouraging economic growth and managing inflation levels. So how does the Fed know when the economy needs help? Economists watch a wide range of indicators, data sets, and market signals. This chapter covers:

  • GDP/GNP
  • Consumer price index (CPI)
  • Yield curves
  • Leading indicators
  • Coincident indicators
  • Lagging indicators
  • Economic market structures

GDP / GNP

Economic growth is commonly measured by gross domestic product (GDP) or gross national product (GNP).

  • GDP measures the value of all goods and services produced within a country’s borders. Economists often use it as a broad measure of domestic economic strength.
  • GNP measures the value of all goods and services produced by a country’s residents, even if production happens outside the country (for example, goods sold by a U.S. citizen while temporarily living in Spain).

GDP and GNP are reported in constant dollars, meaning the data are adjusted for inflation. This makes it easier to compare output across different time periods.

When GDP rises, more goods and services are being produced and sold, which signals economic growth. The faster GDP rises, the faster the economy is growing.

When GDP falls, fewer goods and services are being produced and sold, which signals economic weakness. If this continues long enough, the economy may enter a recession or depression.

  • A recession is two consecutive quarters (six months) of GDP decline.
  • A depression is six straight quarters (a year and a half) of GDP decline.
Sidenote
Price elasticity

GDP tells us whether overall production and spending are rising or falling, but it doesn’t tell us which goods and services are affected most. That’s where price elasticity comes in.

Price elasticity describes how sensitive demand is to changes in price. Think about the word elastic - like a rubber band. It stretches when pulled and then returns to its original shape.

Here’s one of Merriam-Webster’s definitions:

Elastic (adjective)
Capable of being easily stretched or expanded and resuming former shape

Demand for elastic goods and services is flexible: when price rises, demand falls quickly. A good or service is more likely to be elastic when it’s not a necessity or when there are many substitutes. For example, ride-sharing services like Uber and Lyft are often elastic. If Uber’s price rises, many customers switch to Lyft (or another option), so demand drops.

Demand for an inelastic good or service is the opposite: demand doesn’t change much when price changes. Many prescription drugs are commonly cited as inelastic; the EpiPen is an excellent example. Millions of Americans are prescribed EpiPens to treat severe allergic reactions. In 2016, the price of an EpiPen rose to about $700. While overall demand fell slightly, many people still needed them. The higher price didn’t stop millions of Americans from buying an EpiPen (or several), which is why demand is considered inelastic.

In an economic downturn, overall spending tends to fall, but the decline is usually sharper for elastic goods. Demand for inelastic goods often holds up better, even during a recession.

When GDP declines, the Fed typically pursues loosening (expanding) policies to increase the money supply. As interest rates fall, borrowing becomes cheaper, which can lead consumers to buy more homes, cars, and other goods.

As a reminder, if the economy is shrinking, the Fed may take one or more of these actions:

  • Lower their discount rate
  • Engage in repurchase agreements with banks
  • Lower bank reserve requirements
  • Lower Regulation T (margin rules)
Sidenote
Economic cycles

The U.S. economy tends to move through cycles over time.

When GDP rises, the economy is in an expansionary (or expanding) phase. Low interest rates and tax-friendly laws can support expansion. When money is easier to obtain - either through borrowing or through employment - households and businesses tend to spend more, which helps the economy grow.

Eventually, the economy reaches a peak, although it’s hard to identify a peak in real time. Even if there’s short-term turbulence, the economy can still recover before sliding into recession. The Federal Reserve can influence how these transitions play out.

Generally speaking, an economic peak often includes:

  • Low interest rates
  • High GDP/GNP levels
  • Low unemployment levels

Over time, the economy typically begins to recede (shrink). Sometimes this happens because of a “bubble” in a particular sector. For example, the U.S. housing bubble contributed significantly to the Great Recession of 2008. In other cases, the Fed may contribute to a slowdown through tightening measures, usually in response to rising inflation (for example, the 2021-2023 inflation surge).

When interest rates rise, less money is borrowed, which tends to reduce consumer spending. Lower spending can pressure company revenues and prices, which can lead to layoffs and rising unemployment - further weakening the economy. Over time, higher interest rates and reduced economic activity can stabilize prices and bring inflation down.

At some point, the economy reaches a trough - its lowest point - though, like a peak, it’s difficult to identify while it’s happening. Generally speaking, an economic trough often includes:

  • High interest rates
  • Low GDP/GNP levels
  • High unemployment levels

After prices stabilize, the Fed often encourages growth by loosening the money supply. By injecting more money into the system, borrowing becomes more affordable, which can increase purchases of goods and services.

The economy begins to recover when GDP starts rising again, signaling a return to expansion. Job openings tend to increase, consumer confidence improves, and spending accelerates. Recovery and expansion look similar, but recovery specifically refers to the period after a recession.

To summarize, economies typically follow these cycles over time in this order:

Expansion

  • Growing GDP - Unemployment falls

Peak

  • Highest GDP
  • Lowest unemployment

Recession

  • Shrinking GDP
  • Unemployment rises

Trough

  • Lowest GDP
  • Highest unemployment

Recovery

  • GDP growing again
  • Unemployment starts falling

The U.S. economy has a history of following these cycles, and it continues to do so. For the exam, you’ll need the basics of each phase and how the Federal Reserve typically responds.

Consumer price index (CPI)

The Federal Reserve follows the consumer price index (CPI) to gauge inflation levels. Each month, the U.S. Bureau of Labor Statistics tracks prices for goods and services commonly purchased by households, including gasoline, groceries, cell phone contracts, and real estate.

  • If prices rise on average, CPI rises.
  • If prices fall on average, CPI falls.

When CPI rises more than expected, the Fed pays close attention. Inflation can be a side effect of the Fed’s own loosening policies: if too much money enters the money supply, prices may rise.

When inflation is rising, the Fed may use one or more tightening (contracting) policies to reduce the money supply and manage inflation:

  • Raise the discount rate
  • Engage in reverse repurchase agreements with banks
  • Raise bank reserve requirements
  • Raise Regulation T (margin rules)

These actions reduce the money supply, which tends to push interest rates higher. Money behaves like other goods: when there’s less of it available, it becomes more expensive to borrow. Higher interest rates usually reduce borrowing and spending, which can help stabilize prices over time.

Sidenote
Personal Consumption Expenditure (PCE) Price Index

Technically, the Federal Reserve targets inflation using the Personal Consumption Expenditure (PCE) Price Index. It’s similar to CPI, but it uses different weighting and measurement methods.

If you want the details, this article is a helpful reference: PCE vs. CPI: What’s the difference and why it matters right now

Yield curves

Federal Reserve actions strongly influence the bond market. One way to track changing conditions is with yield curves, which show the yields of similar debt securities across different maturities.

For example:

Time money chart

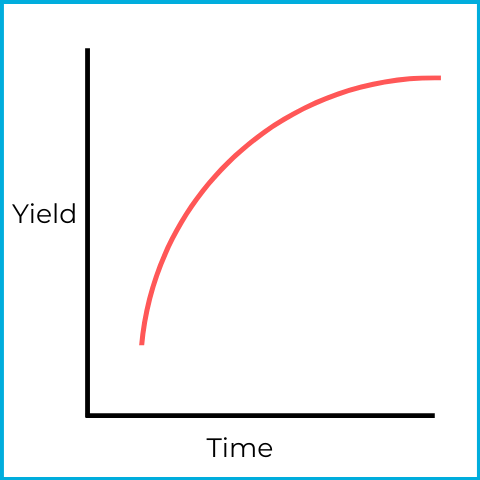
This is a normal (ascending) yield curve. Short-term maturities have lower yields, and longer maturities have higher yields. This is typical because longer time periods generally involve more risk exposure.

Sometimes, the yield curve reflects a different bond environment. For example:

Time money chart

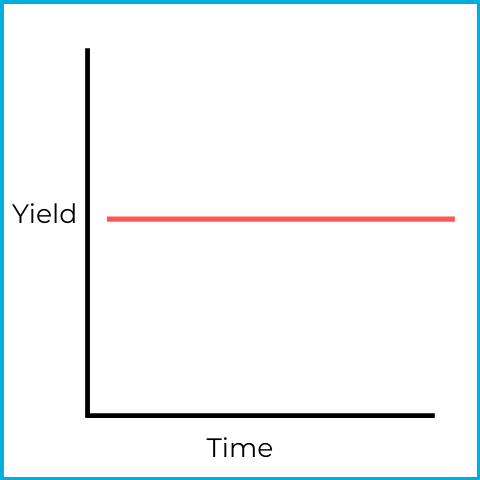
This is a flat yield curve, which signals uncertainty. Short-term and long-term debt securities offer similar yields, which is unusual.

One way this can happen is if investors sell short-term securities and buy long-term bonds:

  • Lower demand for short-term securities pushes prices down and yields up.
  • Higher demand for long-term bonds pushes prices up and yields down.

Together, these moves can flatten the curve.

Time money chart

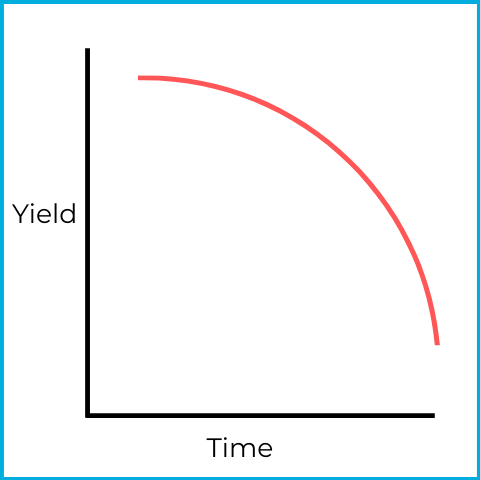
This is an inverted (descending) yield curve, which can signal a pending recession. Short-term debt securities have higher yields than long-term debt securities.

An inverted yield curve often follows the same forces that create a flat curve (the curve may flatten first and then invert). If investors expect a recession, they may sell short-term securities and buy long-term bonds.

Why? The Fed typically tries to lower interest rates during a recession. If investors expect rates to fall, they may buy long-term bonds to lock in higher coupons before rates decline. Also, when interest rates fall, bond prices rise, which creates potential for capital appreciation.

Investors can find yield curves for the overall bond market or for specific sectors (corporate, municipal, U.S. government, etc.). There are also comparative yield curves, sometimes called credit yield spreads, which compare two yield curves - often U.S. government versus corporate.

Time money chart

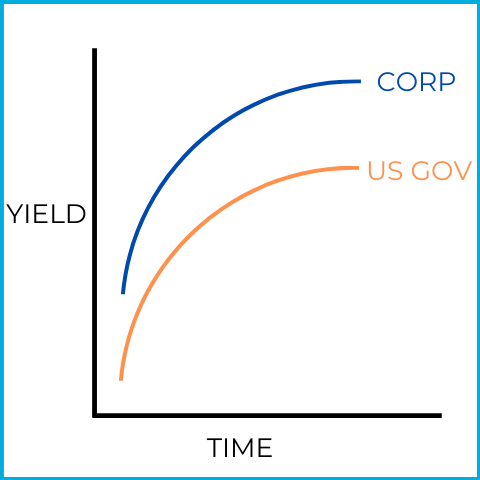
Corporate debt securities usually have higher yields than U.S. government securities because corporate bonds carry more risk. Comparative yield curves focus on the distance between the two curves.

Time money chart

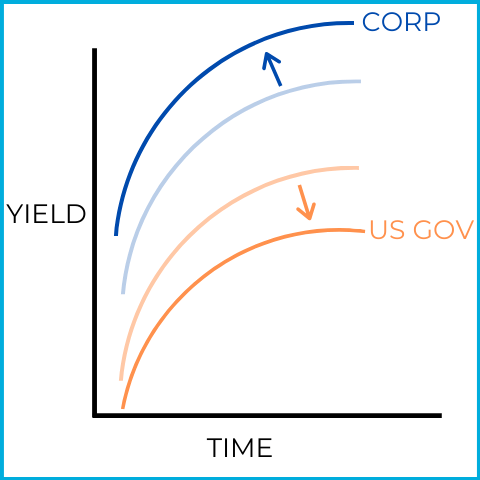
This picture shows the yield curves widening (moving farther apart), which can signal a recession. Investors may sell riskier corporate bonds and buy safer U.S. government securities.

  • Lower demand for corporate bonds pushes prices down and yields up.
  • Higher demand for U.S. government bonds pushes prices up and yields down.

This shift toward safety is why a widening yield curve can be a warning sign.

Time money chart

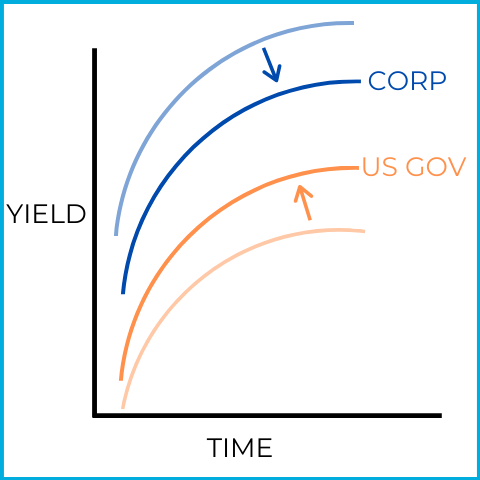
This picture shows the yield curves narrowing (moving closer together), which can signal expansion. Investors may sell safer U.S. government bonds and buy riskier corporate bonds.

  • Higher demand for corporate bonds pushes prices up and yields down.
  • Lower demand for U.S. government bonds pushes prices down and yields up.

This shift toward risk is why a narrowing yield curve can be a sign of economic strength.

Key points

Gross domestic product (GDP)

  • Measure of goods and services produced and sold domestically
  • Reported in constant (inflation-adjusted) dollars
  • Tracks economic growth

Recession

  • Two quarters (six months) of GDP decline

Depression

  • Six quarters (a year and a half) of GDP decline

Elastic good or service

  • Demand falls drastically as price rises
  • Is not a necessity or has competition

Inelastic good or service

  • Demand is generally not affected as price rises
  • Is a necessity with little or no competition

Inflation

  • Measured by CPI
  • Fed tightens the money supply if levels rise

Yield curve

  • Visual representation of bond yields
  • Typically covers similar quality bonds of varying maturities

Normal (ascending) yield curve

  • Short-term securities have lower yields than long-term securities
  • Typical for normal economic conditions (expansion)

Flat yield curve

  • Short-term securities have the same yields as long-term securities
  • Sign of uncertainty in the economy

Inverted (descending) yield curve

  • Short-term securities have higher yields than long-term securities
  • Sign of economic recession

Comparative yield curves

  • Compares yield curves of US Government vs. corporate securities
  • Widening is a sign of recession
  • Narrowing is a sign of prosperity

Sign up for free to take 9 quiz questions on this topic

All rights reserved ©2016 - 2026 Achievable, Inc.