


Achievable logoAchievable logo
AP Macroeconomics
Sign in
Sign up
Purchase
Textbook
Practice exams
Support
How it works
Exam catalog
Mountain with a flag at the peak
Textbook
Example
1. Core economic concepts
2. Measurement of economic performance
3. Modeling of income and prices
4. Financial sector
5. Long-run consequences of stabilization policy
6. Open economy
6.1 Exchange rates
6.2 Foreign exchange market
6.3 Balance of payments
6.4 Exchange rate regimes and the long run
6.5 Open economy $AD$ and policy
Achievable logoAchievable logo
6.4 Exchange rate regimes and the long run
Achievable AP Macroeconomics
6. Open economy
Our AP Macroeconomics course is currently in development and is a work-in-progress.

Exchange rate regimes and the long run

9 min read
Font
Discuss
Share
Feedback

Exchange rates can be loosely split into two major types of systems, which are commonly called exchange rate regimes.

Definitions
Floating exchange rate regime
When the exchange rate is determined by market forces. Government or central bank actions may affect this equilibrium, but that still occurs through the interaction of supply and demand.
Fixed exchange rate regime
When a country fixes the value of its currency to another currency or a commodity. Historically, this was gold or silver.

This century, most major currencies are examples of floating exchange rates. For example, the US dollar, the British pound, the Japanese yen, and the Australian dollar.

The euro, which is a currency union, is technically a form of a fixed exchange rate regime. Countries in the Eurozone use the same paper money, with slightly different coins made by each.

Another present day example is the Danish krone, which is fixed to the euro at a rate of one euro per 7.46038 Danish krone. The Danmarks Nationalbank is officially required to holds the the exchange rate within 2.25% of this value.

A final case of a special fixed exchange rate system is dollarization, sometimes called dollarisation. This refers to situations where a foreign currency is used as an official currency. Sometimes the foreign currency is accepted alongside the home currency, often at a fixed exchange rate. In the extreme, only the foreign currency is used.

Arrangement Currency Country Examples
Exclusive use Euro Andorra
At par with home currency US Dollar Panama
South African rand Namibia
Other fixed rate with home currency US Dollar Belize
At par, only produces coins US Dollar Ecuador
Australian dollar Nauru
New Zealand dollar Cook Islands

There are also two regions in Africa that are working towards formal currency unions similar to the Euro, with further plans for them to join together.

The details of how any of these fixed exchange rate arrangements are maintained are not of concern to us at this level, but the consequences are.

The trilemma (impossible trinity)

There is an inherent trade-off with regards to capital flows, monetary policy and exchange rates. This is referred to as the trilemma or the impossible trinity. What it says if that of these three international factors,

  1. Free capital flows
  2. Independent monetary policy (control of money supply)
  3. Fixed exchange rate

that only two can be true at the same time. Put another way, a country has to give up one in order to choose the other two.

So for example, countries that have a floating exchange rate instead of a fixed exchange rate must have free capital flows and have the option of independent monetary policy. This case includes most of the major economies of the world, the United States, the Eurozone and Great Britain.

Countries with fixed exchange rates generally give up independent monetary policy and control of their own money supply. In fact, Panama does not even have a central bank at all! This case covers all of the arrangements mentioned as examples above.

The final case is when countries restrict flows of international funds, either in or out. Countries with this arrangement include China and North Korea. Capital controls have also been used during crisis situations in order to stabilize floating exchange rates or financial markets and to raise government revenue.

Purchasing Power Parity (PPP)

Over the long run, real exchange rates should have some relationship to the real purchasing power of the currency. This concept is called purchasing power parity (PPP). There are two main economic theories of how exchange rates should change over time.

Definitions
Absolute PPP
In the long run all real exchange rates should be equal to 1.
Relative PPP
Changes in exchange rates should be equal to differences in inflation.

We will now expand on the discussion of each.

Absolute PPP

Absolute PPP implies that all currencies should eventually have equal purchasing power. Realistically we should see this if a few assumptions hold. Every good in the two countries must be perfectly identical and every good and service must be tradeable. These are not realistic conditions. Goods are often not identical and services are often difficult to trade.

You may be able to import avocados from Mexico, but you cannot import a haircut. If you live near the border someone could drive across to cut your hair, but that is not an option for everyone. Even in that case whatever service was provided would not strictly be an import and would count for US GDP and not Mexico’s.

As a consequence, the more identical and easily traded a good is, the more likely that absolute PPP will hold for that specific good. Based on that very idea, the Economist magazine created the “Big Mac Index” to allow for an objective measure of how “overvalued” or “undervalued” a currency is by using exchange rates and the price of a Big Mac.

To explore this numerically, the table below presents values for a different good, a half liter (500 mL) bottle of Coca-Cola.

Currency Price Nominal Exchange RER
US dollar 2.99 USD 1 1
Euro 2.5 EUR 0.8694 EUR/USD 0.86942.5​=2.88
Indian Rupee 30 INR 88.814 INR/USD 88.81430​=0.34
South African Rand 80 ZAR 17.095 ZAR/USD 17.180​=4.68

It seems like a homogenous product, so it might be natural to question why there are such significant differences in the real exchange rate. There are a few broadly identifiable reasons why that is.

First, it’s not actually perfectly homogenous. There are differences in production costs (energy, sweeteners, packaging), costs of transportation, taxes, and retailer markups (profits at point of final sale). The second is that the exchange rate is a reflection of wider interactions beyond a single good, and it is unlikely that a half liter bottle of Coca-Cola is the key product traded for any of these countries.

Relative PPP

In contrast to absolute PPP, Relative PPP says that changes in the real exchange rate should be approximately equal to the difference in the inflation rate. So if a country has a consistently higher inflation rate than the United States, and everything else stays equal, the currency of that country should get weaker.

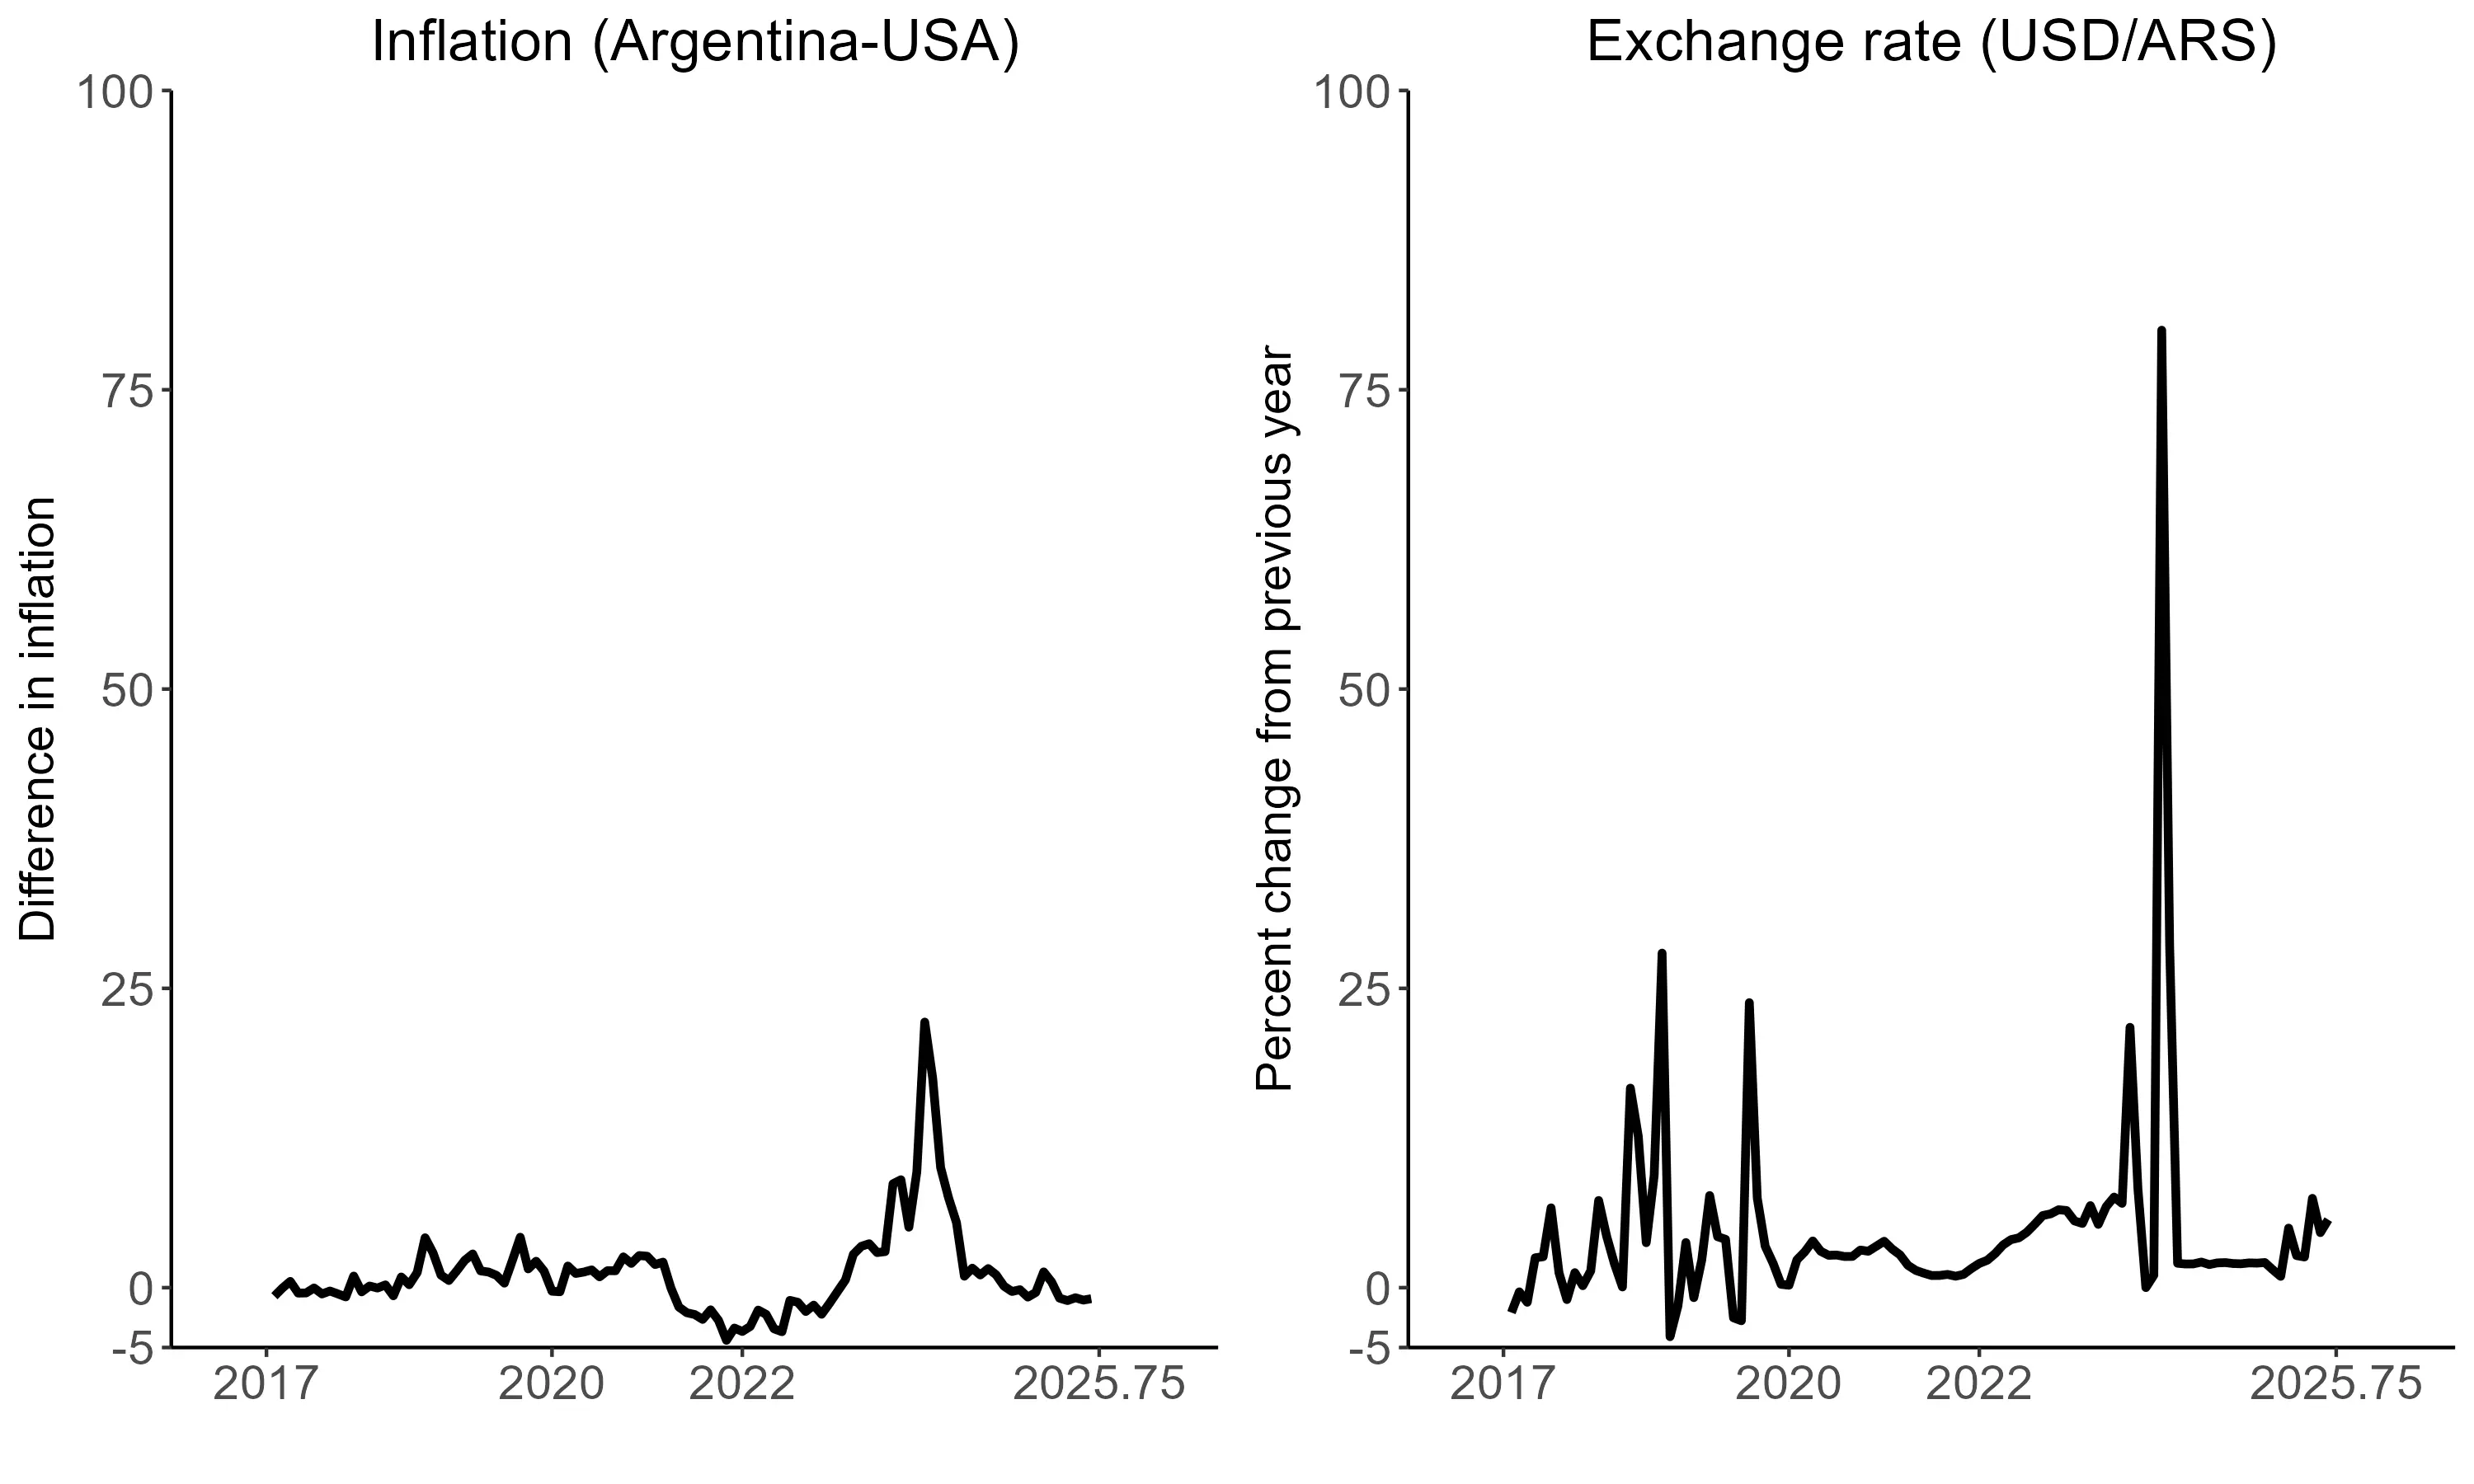
As a quick example, let us look at Argentina compared to the United States, using monthly data from 2017 through September of 2025. The reason for the awkward stopping point is data availability, October 2025 is missing in the US data due to a government shutdown.

Light connection between relative inflation and change in currency value for Argentina and the United States (2020-2024)
Relative PPP (direct calculation)
INDEC (Argentina National Institute of Statistics and Census)
/
Public domain

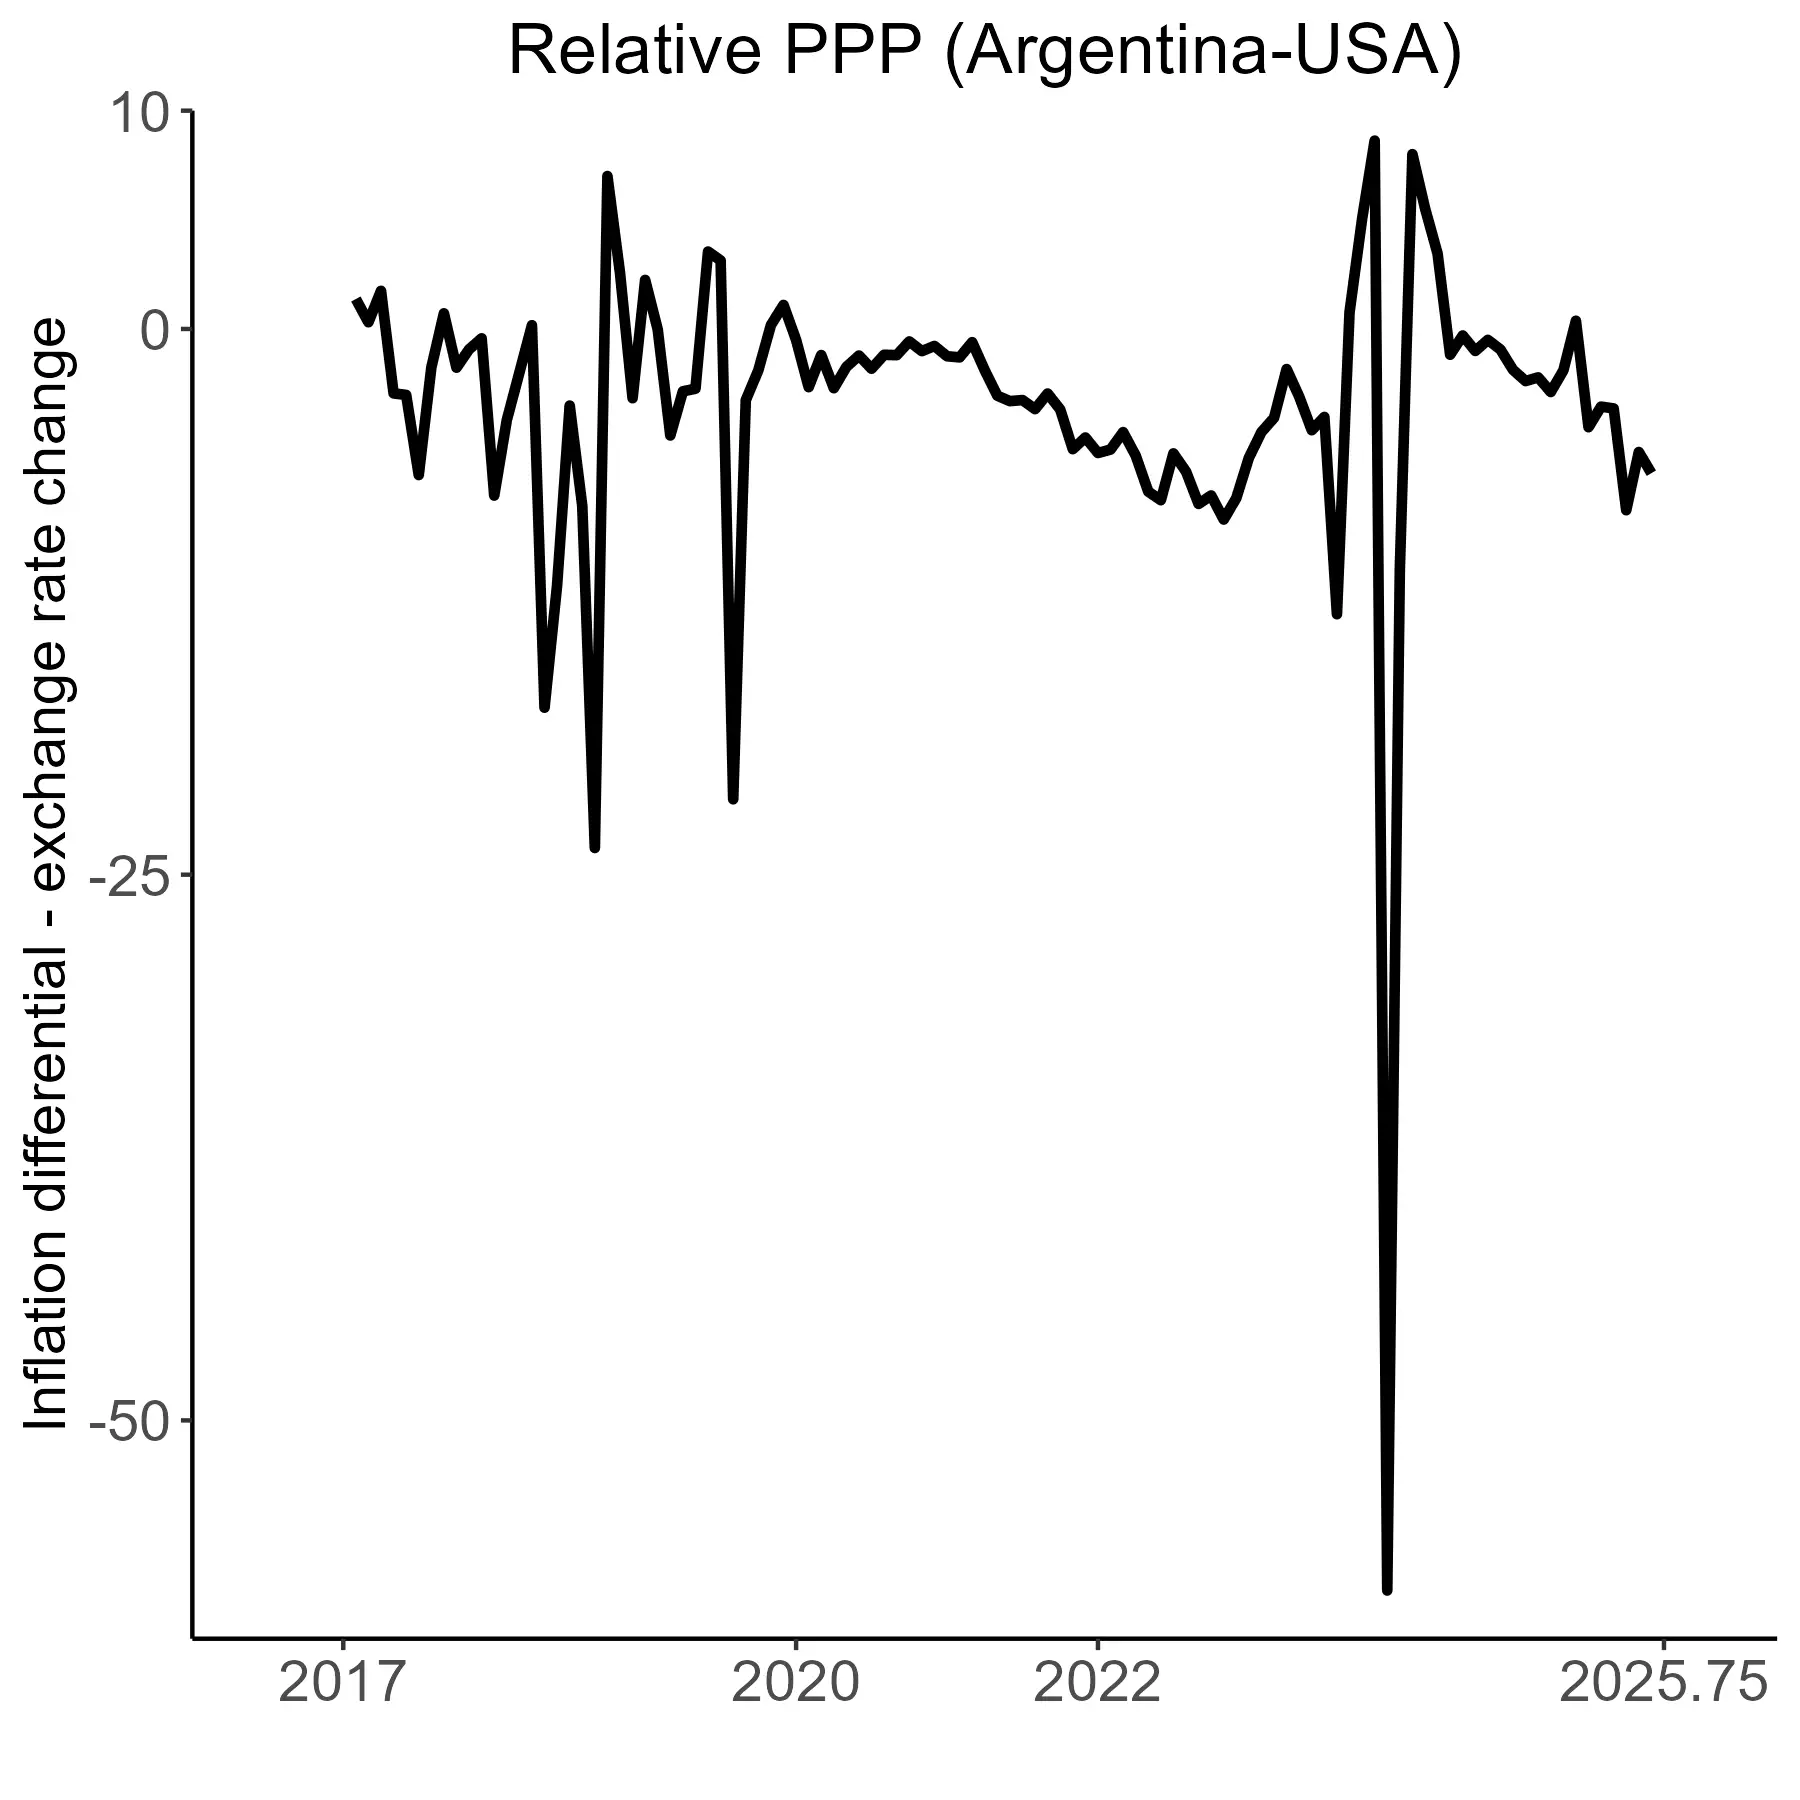
Comparatively, we can see that while the values look similar the currency seems to move more than relative inflation. In particular, the inflation spike in 2024 was accompanied by a larger exchange rate movement. This becomes more clear when we calculate the relative PPP deviation

Deviation=Argentina inflation−US inflation−ARS/USD change,​

which will be zero if relative PPP holds exactly.

Light connection between relative inflation and change in currency value for Argentina and the United States (2020-2024)
INDEC (Argentina National Institute of Statistics and Census)
/
Public domain

The currency movements are more wild because in this situation everything else was not equal. In Argentina there was an election and significant policy changes in terms of government spending and getting inflation under control. The continued depreciation of the Argentine peso could reflect expectations that these policies will not last.

Source: World Bank World Development Indicators, accessed: 4/19/26
Country GDP per capita, 2019 PPP Adjusted 2019
United States 64,746 65,228
Switzerland 84,122 73,732
China 10,343 17,601
Mexico 10,370 20,964

Just looking at a few countries in 2019 gives some perspective on what PPP adjustments give us. Without the adjustment, China and Mexico appear to have similar income. However, once you adjusted for PPP Mexico’s GDP per capita is actually nearly 20% higher. Similarly, Switzerland’s value seems much higher than the US value, but adjusting for prices brings them closer together.

What this tells us is that the international basket is relatively cheaper in Mexico compared to China and relatively more expensive in Switzerland compared to the United States. When used in these sorts of comparisons, PPP adjustments make all values measured in international dollars, a hypothetical currency that has the same real purchasing power in any location.

Previous
Next  | 6.5 Open economy $AD$ and policy
All rights reserved ©2016 - 2026 Achievable, Inc.

Exchange rate regimes and the long run

Exchange rates can be loosely split into two major types of systems, which are commonly called exchange rate regimes.

Definitions
Floating exchange rate regime
When the exchange rate is determined by market forces. Government or central bank actions may affect this equilibrium, but that still occurs through the interaction of supply and demand.
Fixed exchange rate regime
When a country fixes the value of its currency to another currency or a commodity. Historically, this was gold or silver.

This century, most major currencies are examples of floating exchange rates. For example, the US dollar, the British pound, the Japanese yen, and the Australian dollar.

The euro, which is a currency union, is technically a form of a fixed exchange rate regime. Countries in the Eurozone use the same paper money, with slightly different coins made by each.

Another present day example is the Danish krone, which is fixed to the euro at a rate of one euro per 7.46038 Danish krone. The Danmarks Nationalbank is officially required to holds the the exchange rate within 2.25% of this value.

A final case of a special fixed exchange rate system is dollarization, sometimes called dollarisation. This refers to situations where a foreign currency is used as an official currency. Sometimes the foreign currency is accepted alongside the home currency, often at a fixed exchange rate. In the extreme, only the foreign currency is used.

Arrangement Currency Country Examples
Exclusive use Euro Andorra
At par with home currency US Dollar Panama
South African rand Namibia
Other fixed rate with home currency US Dollar Belize
At par, only produces coins US Dollar Ecuador
Australian dollar Nauru
New Zealand dollar Cook Islands

There are also two regions in Africa that are working towards formal currency unions similar to the Euro, with further plans for them to join together.

The details of how any of these fixed exchange rate arrangements are maintained are not of concern to us at this level, but the consequences are.

The trilemma (impossible trinity)

There is an inherent trade-off with regards to capital flows, monetary policy and exchange rates. This is referred to as the trilemma or the impossible trinity. What it says if that of these three international factors,

  1. Free capital flows
  2. Independent monetary policy (control of money supply)
  3. Fixed exchange rate

that only two can be true at the same time. Put another way, a country has to give up one in order to choose the other two.

So for example, countries that have a floating exchange rate instead of a fixed exchange rate must have free capital flows and have the option of independent monetary policy. This case includes most of the major economies of the world, the United States, the Eurozone and Great Britain.

Countries with fixed exchange rates generally give up independent monetary policy and control of their own money supply. In fact, Panama does not even have a central bank at all! This case covers all of the arrangements mentioned as examples above.

The final case is when countries restrict flows of international funds, either in or out. Countries with this arrangement include China and North Korea. Capital controls have also been used during crisis situations in order to stabilize floating exchange rates or financial markets and to raise government revenue.

Purchasing Power Parity (PPP)

Over the long run, real exchange rates should have some relationship to the real purchasing power of the currency. This concept is called purchasing power parity (PPP). There are two main economic theories of how exchange rates should change over time.

Definitions
Absolute PPP
In the long run all real exchange rates should be equal to 1.
Relative PPP
Changes in exchange rates should be equal to differences in inflation.

We will now expand on the discussion of each.

Absolute PPP

Absolute PPP implies that all currencies should eventually have equal purchasing power. Realistically we should see this if a few assumptions hold. Every good in the two countries must be perfectly identical and every good and service must be tradeable. These are not realistic conditions. Goods are often not identical and services are often difficult to trade.

You may be able to import avocados from Mexico, but you cannot import a haircut. If you live near the border someone could drive across to cut your hair, but that is not an option for everyone. Even in that case whatever service was provided would not strictly be an import and would count for US GDP and not Mexico’s.

As a consequence, the more identical and easily traded a good is, the more likely that absolute PPP will hold for that specific good. Based on that very idea, the Economist magazine created the “Big Mac Index” to allow for an objective measure of how “overvalued” or “undervalued” a currency is by using exchange rates and the price of a Big Mac.

To explore this numerically, the table below presents values for a different good, a half liter (500 mL) bottle of Coca-Cola.

Currency Price Nominal Exchange RER
US dollar 2.99 USD 1 1
Euro 2.5 EUR 0.8694 EUR/USD 0.86942.5​=2.88
Indian Rupee 30 INR 88.814 INR/USD 88.81430​=0.34
South African Rand 80 ZAR 17.095 ZAR/USD 17.180​=4.68

It seems like a homogenous product, so it might be natural to question why there are such significant differences in the real exchange rate. There are a few broadly identifiable reasons why that is.

First, it’s not actually perfectly homogenous. There are differences in production costs (energy, sweeteners, packaging), costs of transportation, taxes, and retailer markups (profits at point of final sale). The second is that the exchange rate is a reflection of wider interactions beyond a single good, and it is unlikely that a half liter bottle of Coca-Cola is the key product traded for any of these countries.

Relative PPP

In contrast to absolute PPP, Relative PPP says that changes in the real exchange rate should be approximately equal to the difference in the inflation rate. So if a country has a consistently higher inflation rate than the United States, and everything else stays equal, the currency of that country should get weaker.

As a quick example, let us look at Argentina compared to the United States, using monthly data from 2017 through September of 2025. The reason for the awkward stopping point is data availability, October 2025 is missing in the US data due to a government shutdown.

Comparatively, we can see that while the values look similar the currency seems to move more than relative inflation. In particular, the inflation spike in 2024 was accompanied by a larger exchange rate movement. This becomes more clear when we calculate the relative PPP deviation

Deviation=Argentina inflation−US inflation−ARS/USD change,​

which will be zero if relative PPP holds exactly.

The currency movements are more wild because in this situation everything else was not equal. In Argentina there was an election and significant policy changes in terms of government spending and getting inflation under control. The continued depreciation of the Argentine peso could reflect expectations that these policies will not last.

Source: World Bank World Development Indicators, accessed: 4/19/26
Country GDP per capita, 2019 PPP Adjusted 2019
United States 64,746 65,228
Switzerland 84,122 73,732
China 10,343 17,601
Mexico 10,370 20,964

Just looking at a few countries in 2019 gives some perspective on what PPP adjustments give us. Without the adjustment, China and Mexico appear to have similar income. However, once you adjusted for PPP Mexico’s GDP per capita is actually nearly 20% higher. Similarly, Switzerland’s value seems much higher than the US value, but adjusting for prices brings them closer together.

What this tells us is that the international basket is relatively cheaper in Mexico compared to China and relatively more expensive in Switzerland compared to the United States. When used in these sorts of comparisons, PPP adjustments make all values measured in international dollars, a hypothetical currency that has the same real purchasing power in any location.

More from Open economy

  • Exchange rates
  • Foreign exchange market
  • Balance of payments
  • Open economy $AD$ and policy