Using Data
Introduction
This module is not about a unique SAT Reading/Writing question type; rather, it concerns questions that accompany the paragraph of information with a graph or chart. These questions are overwhelmingly (but not always) found with questions the SAT calls Command of Evidence questions–questions that demonstrate the student’s understanding of information (in both written and graphic form) and how to apply that content to a claim or hypothesis. The most important strategy is one that you might think is simply common sense but which deserves to be emphasized: always read both the words and the graph with great care.
Approach Question
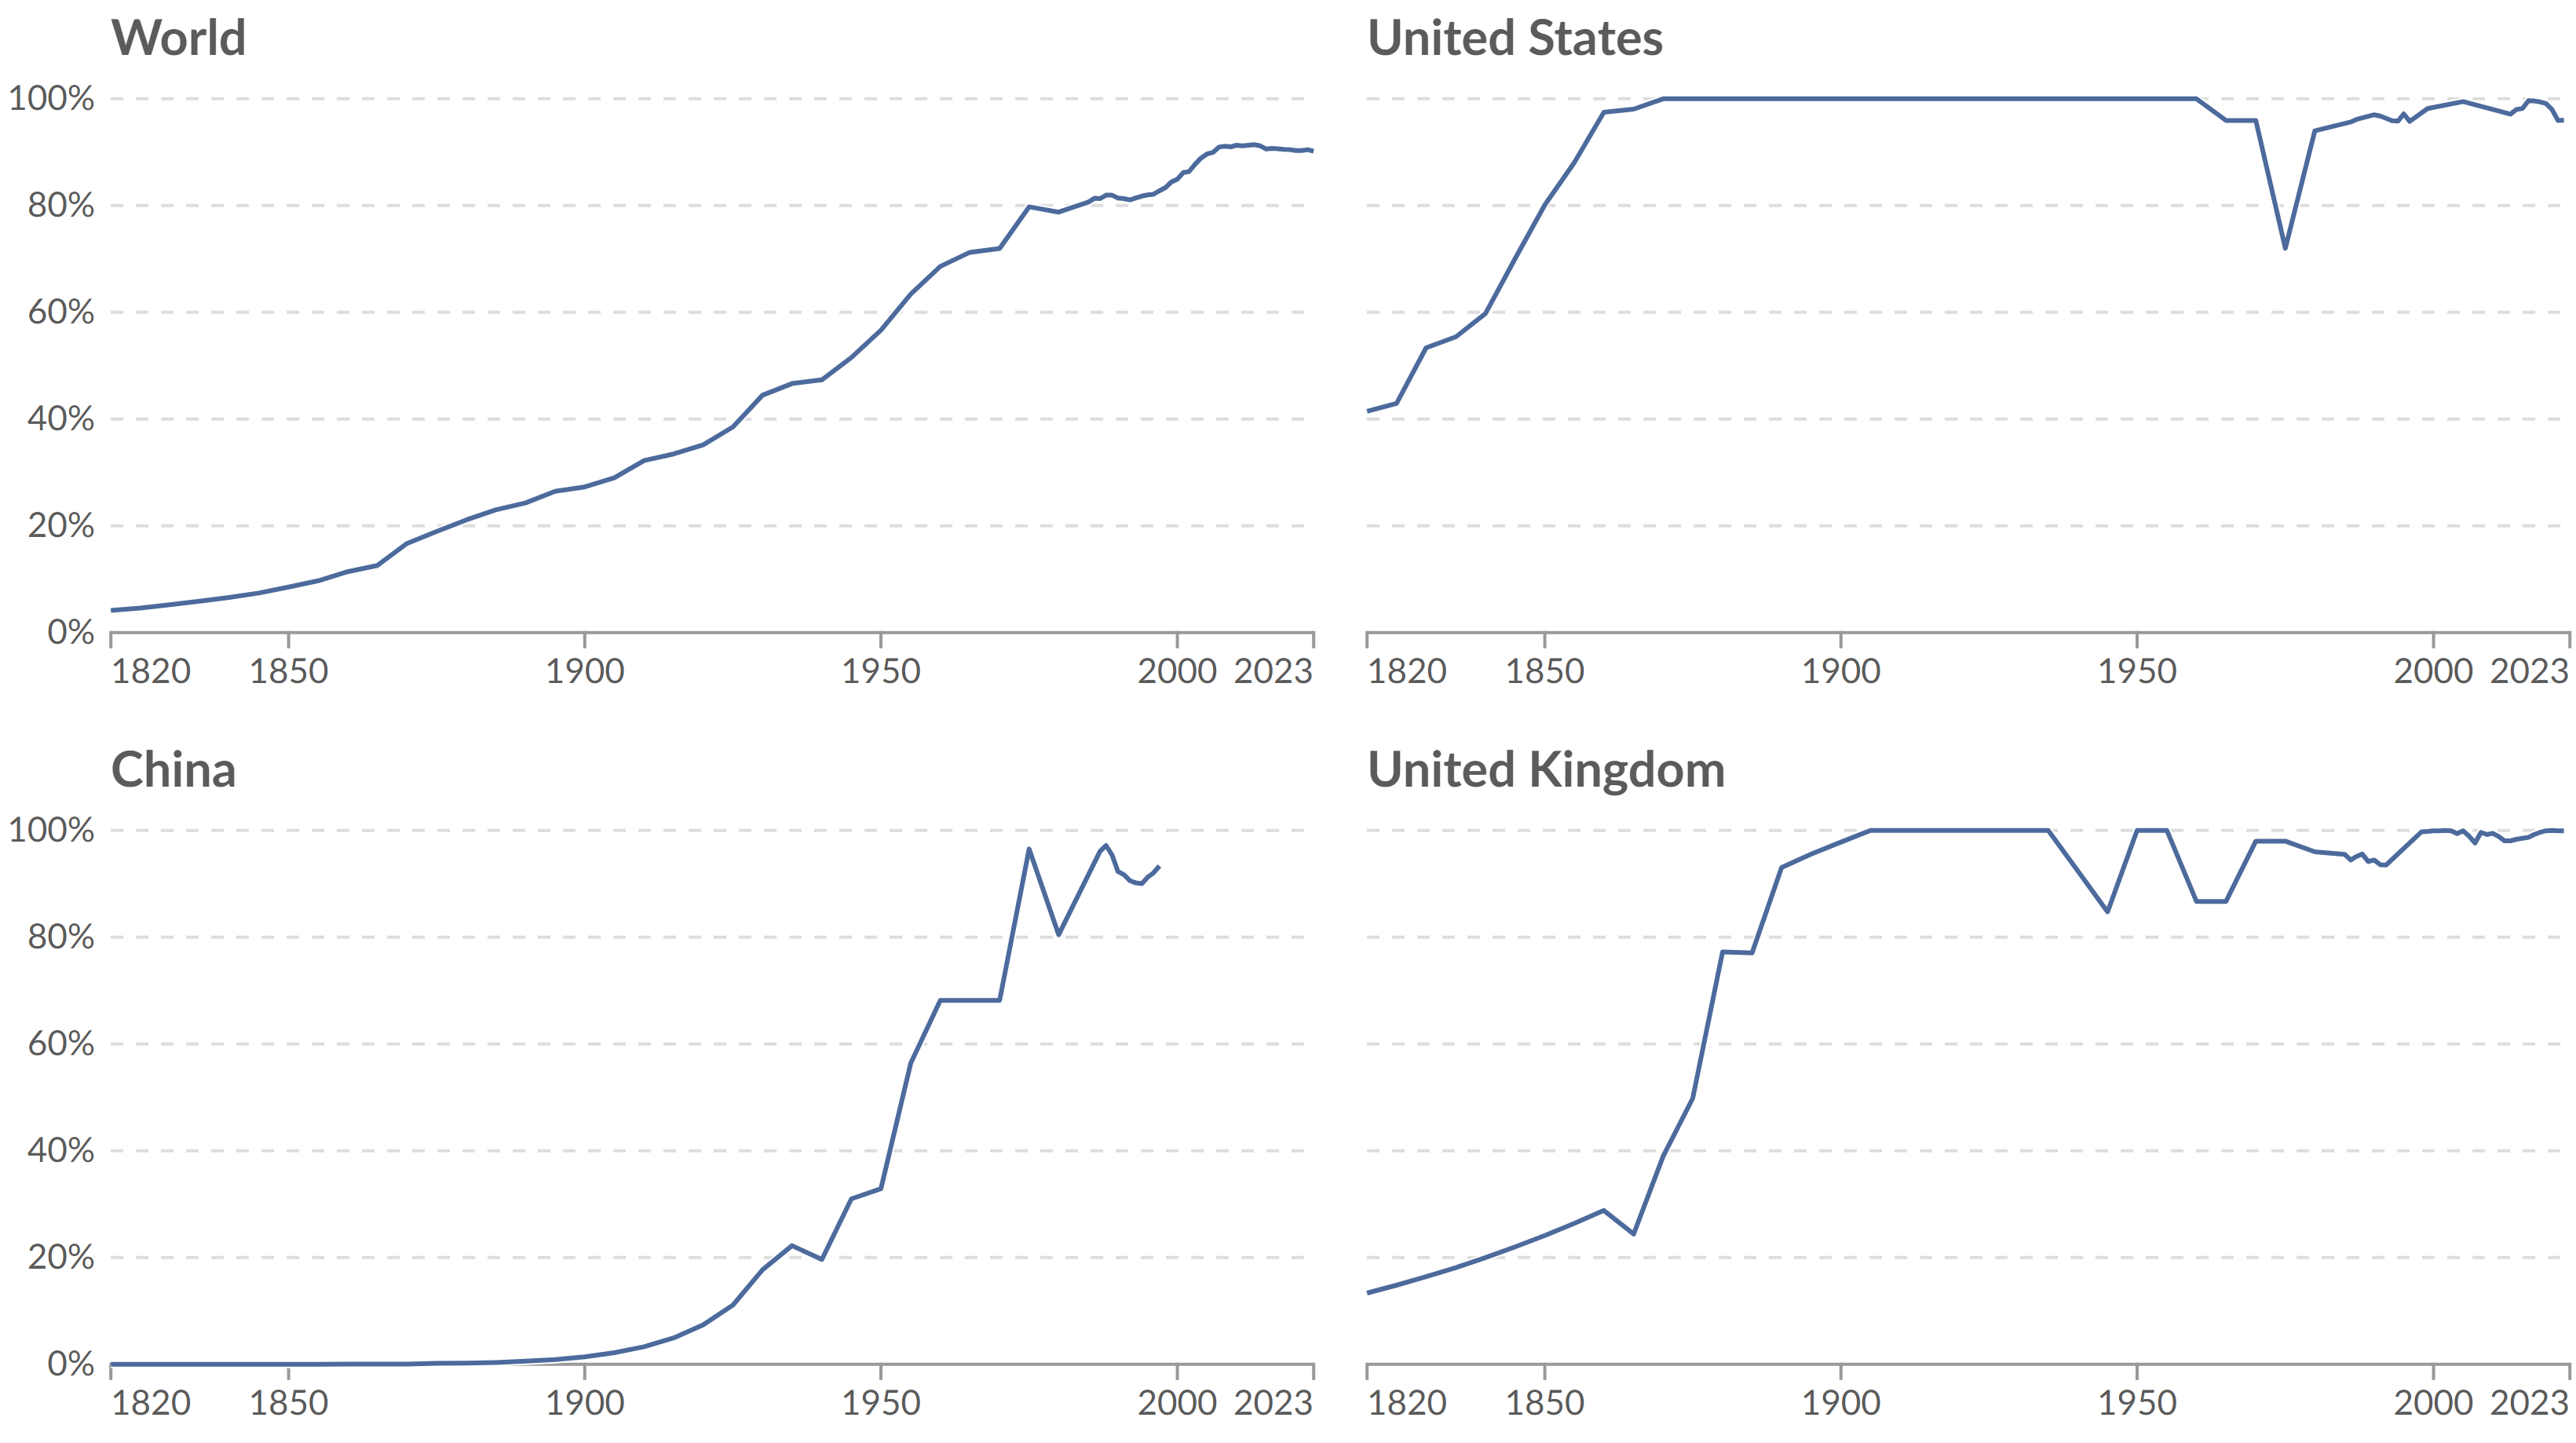
A historian argues that one of the most significant global shifts in the twentieth century was the near-universal adoption of primary education. She notes that this transformation occurred unevenly across countries, with some reaching near-complete enrollment much earlier than others. She suggests that some more recently developed countries lagged behind the worldwide pace of schooling early in the twentieth century but have now eclipsed that pace.
Which choice best provides evidence from the graph to support Zhao’s claim?
A. In China, the percentage of children enrolled in primary school remained below 20% until after 1950, when it began a steep climb toward near-universal levels.
B. In the United States, primary school enrollment reached nearly 100% by the late 1800s and has stayed consistently high since then.
C. In the United Kingdom, enrollment rose sharply around the turn of the twentieth century, leveling off close to 100% by mid-century.
D. Worldwide, primary school enrollment gradually increased throughout the twentieth century, rising from under 40% in 1900 to nearly 90% by 2024.
Explanation
When reviewing a graph given on the SAT, general trends are often the most important detail to discover. But how are such trends observed? Focus your observation on three primary ares: 1) the title of a graph; 2) the axes or headings of a graph/chart (for a typical graph, this will be the x- and y-axes, but for a table it tends to be the first row on top and the first column on the left); 3) the shape of the graph. “Shape” can mean different things in different graphs (and applies much more to graphs than to tables); in this case, we want to focus on the general trend of each line. Are the graphs going up or down? Do they go both up and down, depending on the year, or do they only go one direction? What does this tell us about the change taking place over time?
One thing you will be unlikely to need is extreme detail. For example, a question based on this graph is unlikely to ask you for the level of schooling in the U.S. in 1960, because that would be difficult to determine with precision. Reading/Writing questions will be much more concerns about general trends in the graphs and charts and how those trends help us evaluate a claim.
With this in mind, we can now approach the scholar’s claim in this case. Typically, when someone makes a claim based on the data given, that claim is going to be either obviously true or at least somewhat supported by the information. Your task is to find the right information. Since the scholar is focused on a country that “lagged behind the worldwide pace of schooling early in the twentieth century but [has] now eclipsed that pace,” we go to the graphs looking for that sort of country. It’s not the U.S. or the UK, since both of those countries were ahead of the “World” pace before the 20th century even began. The only “single-country” graph left is China, so we must focus there and ask whether China lagged behind the world early on but surpassed it later. Indeed that is true; the early 1900’s show almost no formal schooling in China, while the very right side of China’s graph line shows evidence of being above the line on the world’s graph. Even if right side comparison is not quite as clear as the left side comparison, China represents the only possible candidate in the graph that could be used to support the scholar’s position. The answer is A.
Data-based Questions: Strategy
- On the graph or chart, notice all headings and axes. What relationships do you see between data factors? Two common examples are directly proportional (when one factor goes up, the other goes up) and inversely proportional (the opposite).
- Read the paragraph but focus especially on the end; typically, a scholar or student is drawing a conclusion at the end of the paragraph, and that conclusion will need to be strengthened or weakened or will lead to an inference in the right answer.
- Use the answers to prompt you as to where you should look at the data more specifically. Watch out for answers that misrepresent the data.
- Avoid answers that describe the data correctly but do not do what the questions ask in response to the argument given in the paragraph.
Topics for Cross-Reference
- Strengthen/Weaken questions
- Inferences questions
- Detail questions
Variations
Most questions that use data will be Strengthen or Weaken questions. Occasionally, data will be used in a question that asks for a detail or an inference from the passage. In these cases, look for answers that draw some conclusion from both the graph and the paragraph, without overstating (in overly extreme terms) what conclusions can be drawn.
Review
Answer this: What does the K in the QUICKER Method stand for?
KNOCK OUT answer choices that don’t fit.
Sample Questions
Difficulty 1
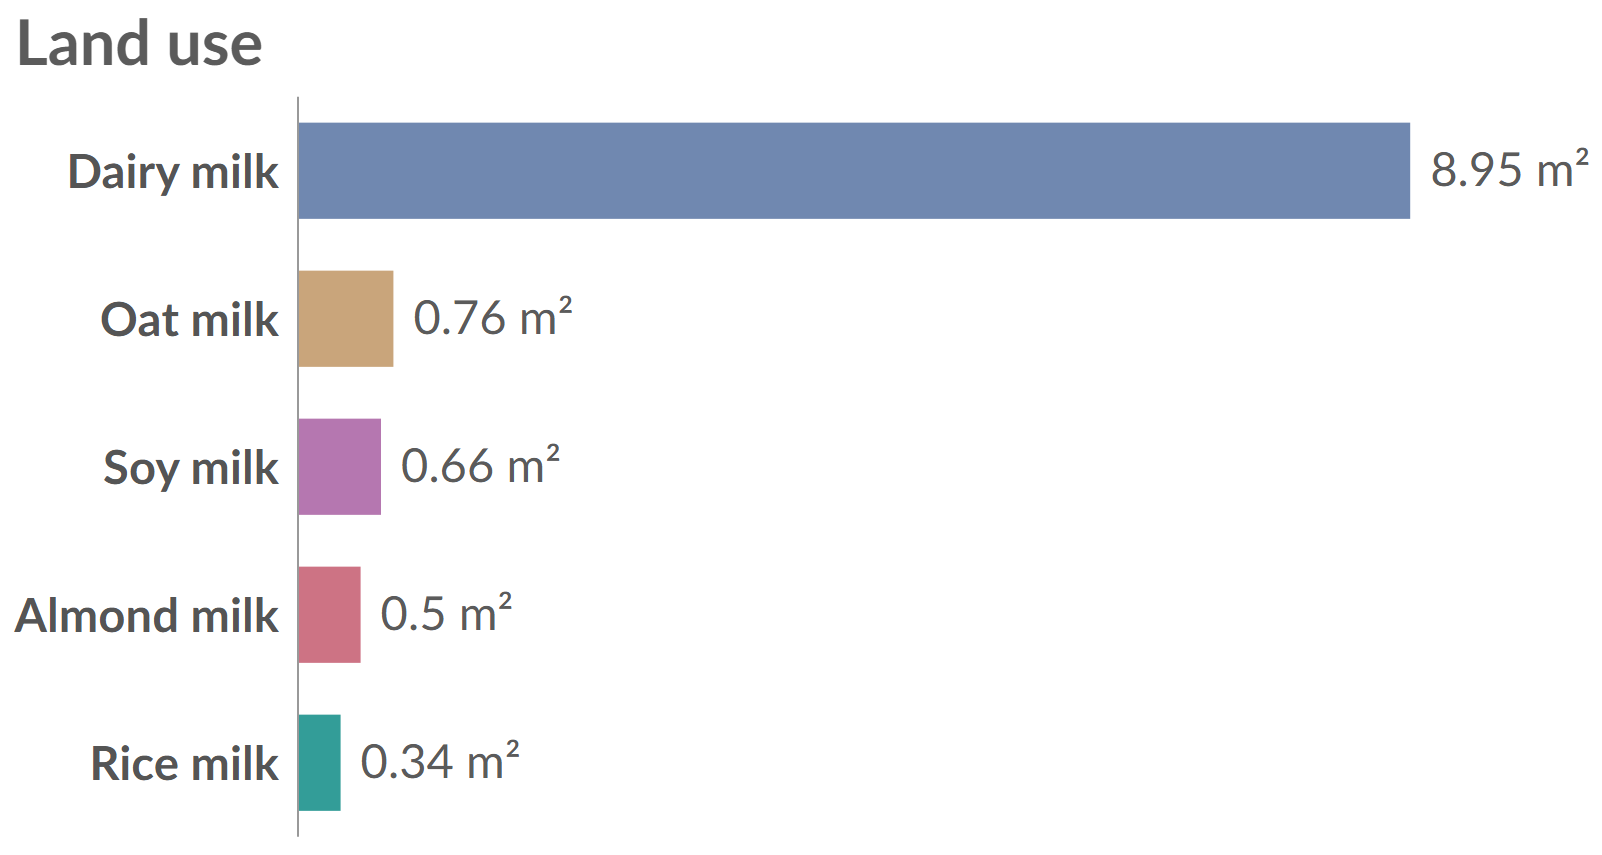
An environmental scientist argues that shifting from dairy milk to plant-based alternatives can dramatically reduce land use in agriculture. She notes that while not all plant milks have identical environmental impacts, each requires far less land per liter than dairy milk. Her claim is based on comparative analyses across multiple production systems. Which choice best provides evidence from the graph to support the environmental scientist’s claim?
A. Dairy milk requires nearly of land per liter, far more than any plant-based alternative shown.
B. Oat milk requires of land per liter, slightly more than soy milk but still well below dairy milk.
C. Almond milk requires of land per liter, while rice milk requires just .
D. Soy milk requires of land per liter, making it less land-intensive than oat milk but more than almond or rice milk.
The answer is A. The key recognition is that “each” of the plant milks is similar. The graph shows that these similar impacts are all much lower than that of dairy milk. So we’re looking for the answer that compares those similar impacts to the much higher impact of dairy milk. That answer highlighting dairy milk’s unique impact is A.
Difficulty 2
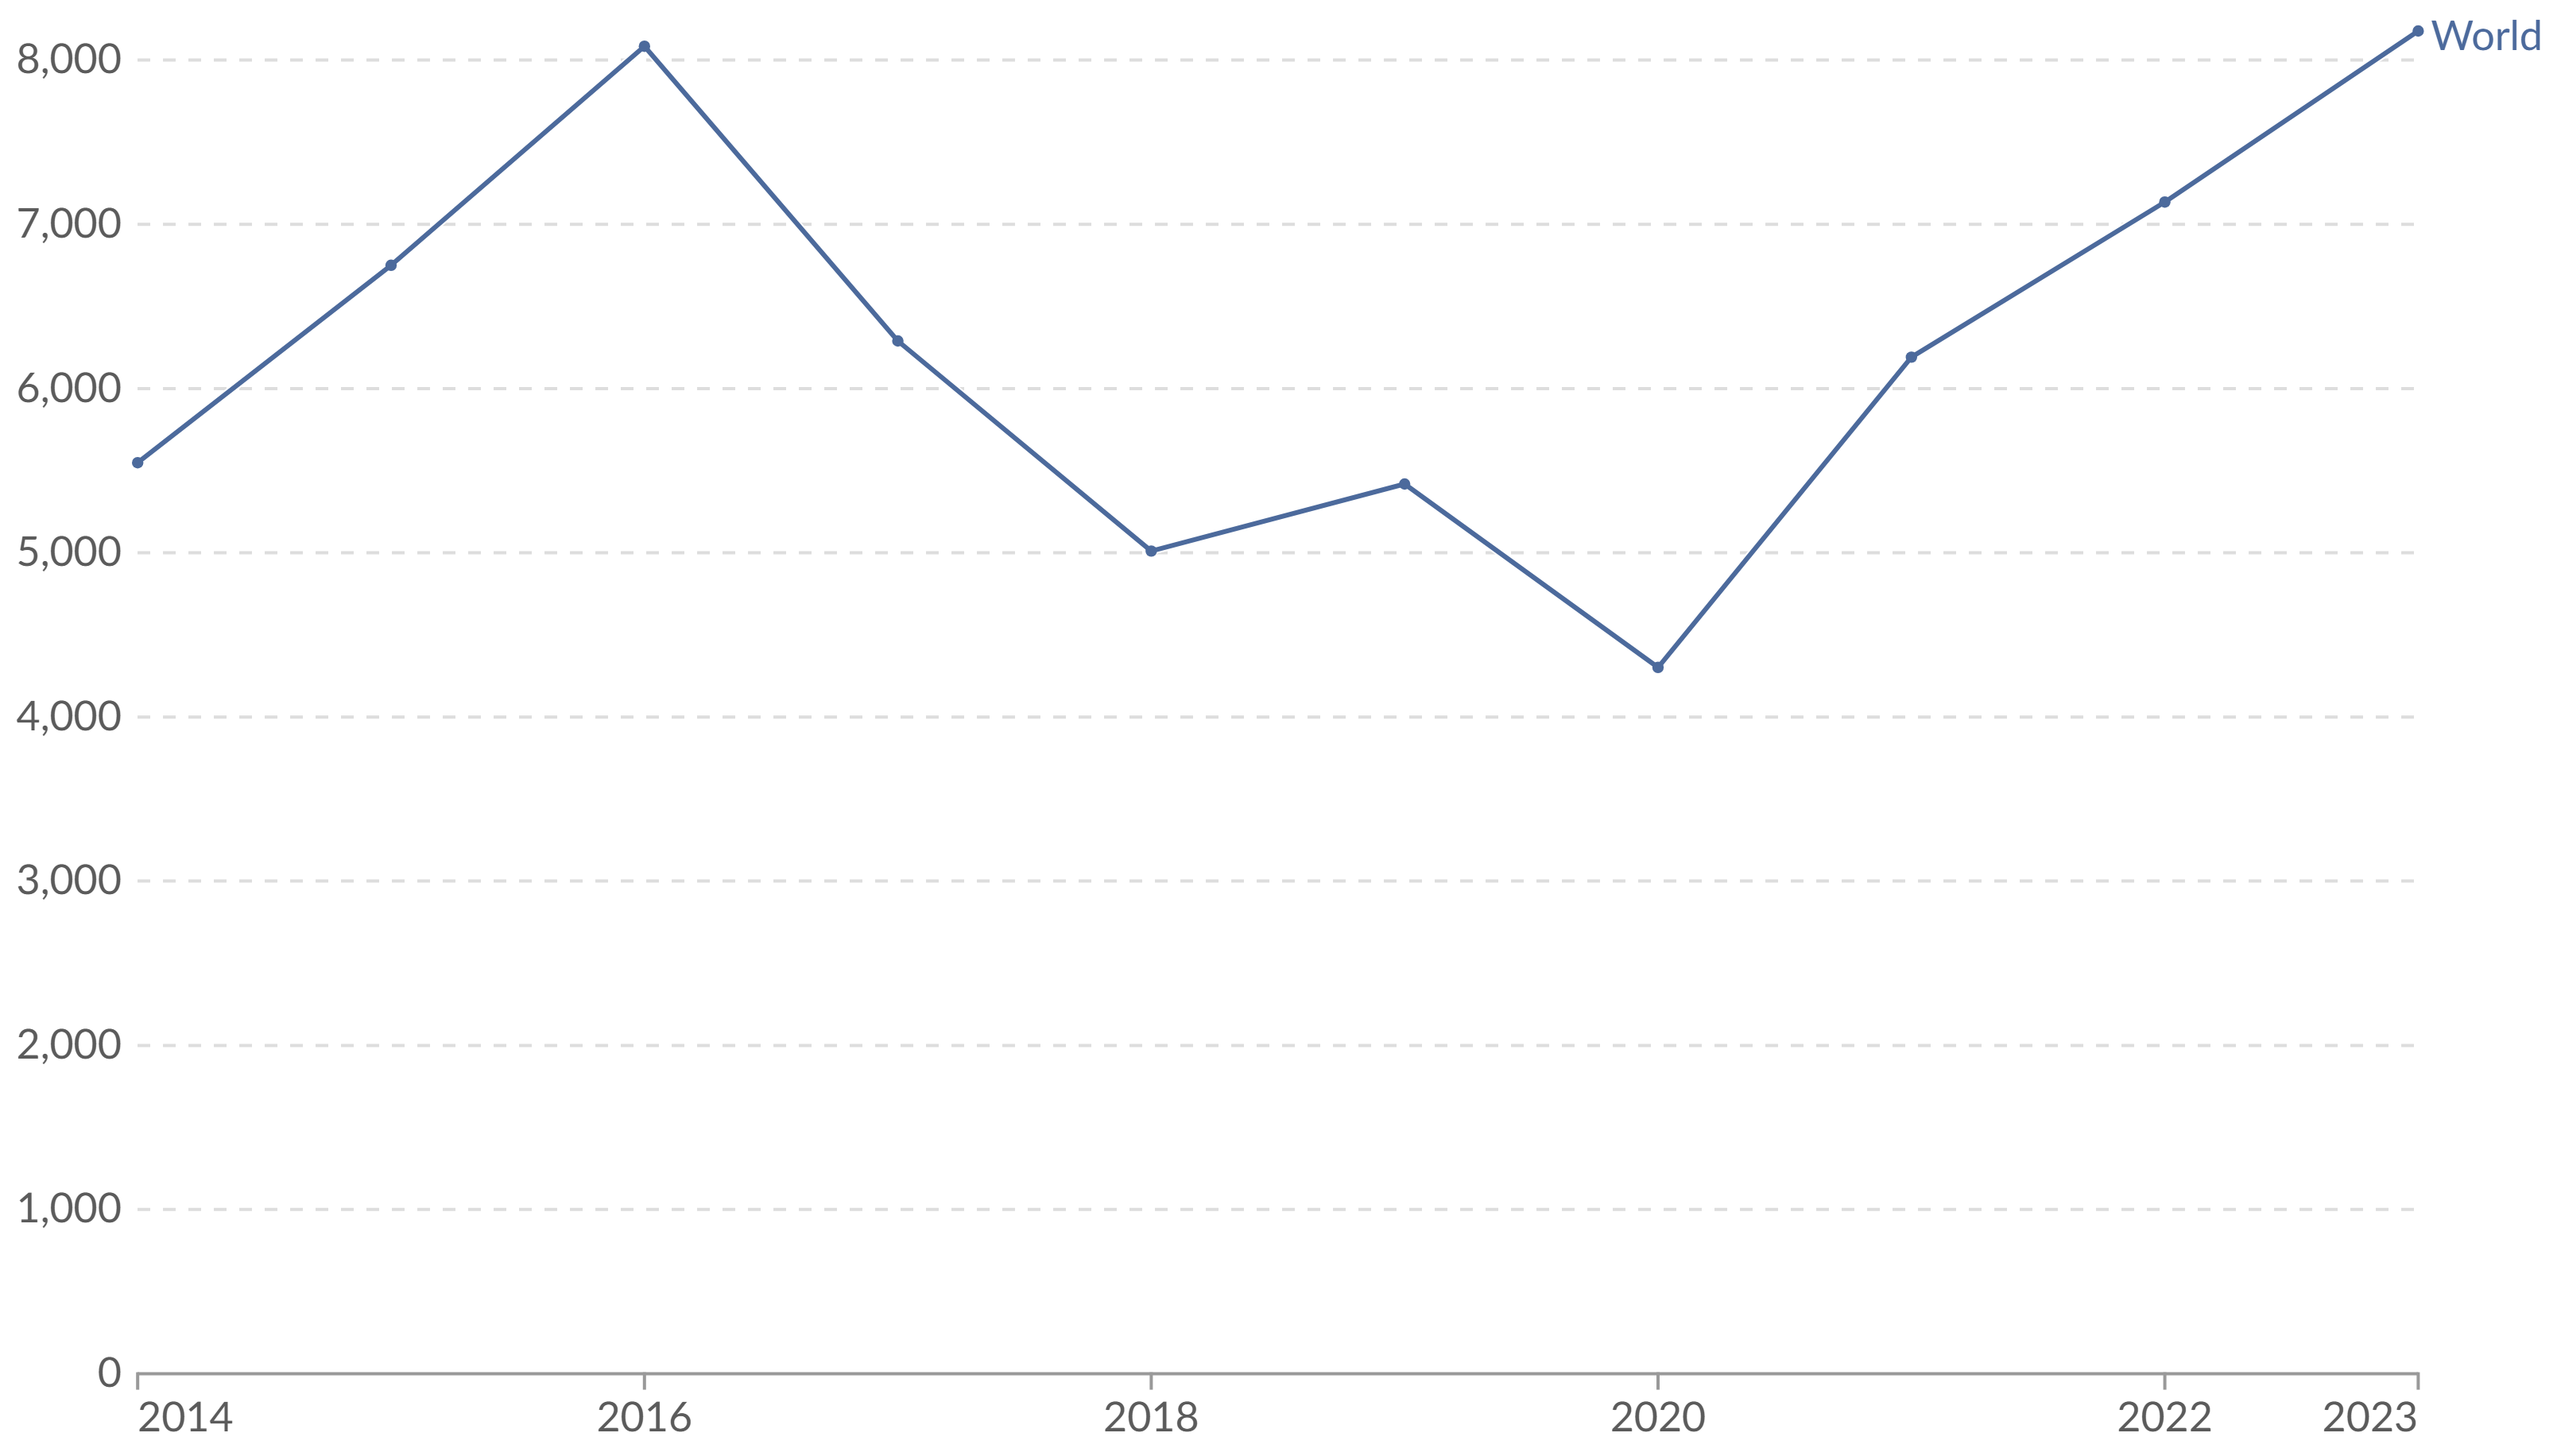
A sociologist studies the risks faced by migrants worldwide, arguing that although there are fluctuations from year to year, the overall data reveal that migration continues to involve significant danger. The absence of any clear long-term decline in recorded deaths and disappearances stands out to the sociologist as he explores the data. He suggests that while the numbers dip at times, the overall trend underscores the persistence of these risks. Which choice best provides evidence from the graph to support the sociologist’s claim?
A. The number of recorded deaths and disappearances fell to around 5,000 in 2018, down from a peak of about 8,000 in 2017.
B. In 2020, recorded deaths and disappearances dropped to their lowest point of the decade, at just over 4,000 cases.
C. After 2020, recorded deaths and disappearances rose, reaching about 8,000 in 2023, similar to the peak observed earlier in 2017.
D. Between 2014 and 2016, recorded deaths and disappearances increased steadily, rising from about 5,500 to nearly 7,000, but dropped after that.
The answer is C. We have a graph that goes up and down combined with a claim of “persistence” of the danger faced by migrants. Since “persistence” needs to guide our reading of the graph, we know we’re looking for something that keeps happening despite occasional opposite movement. Answer choice C gives us the best candidate, since it mentions two instances where deaths and disappearances went up on the graph.
Difficulty 3
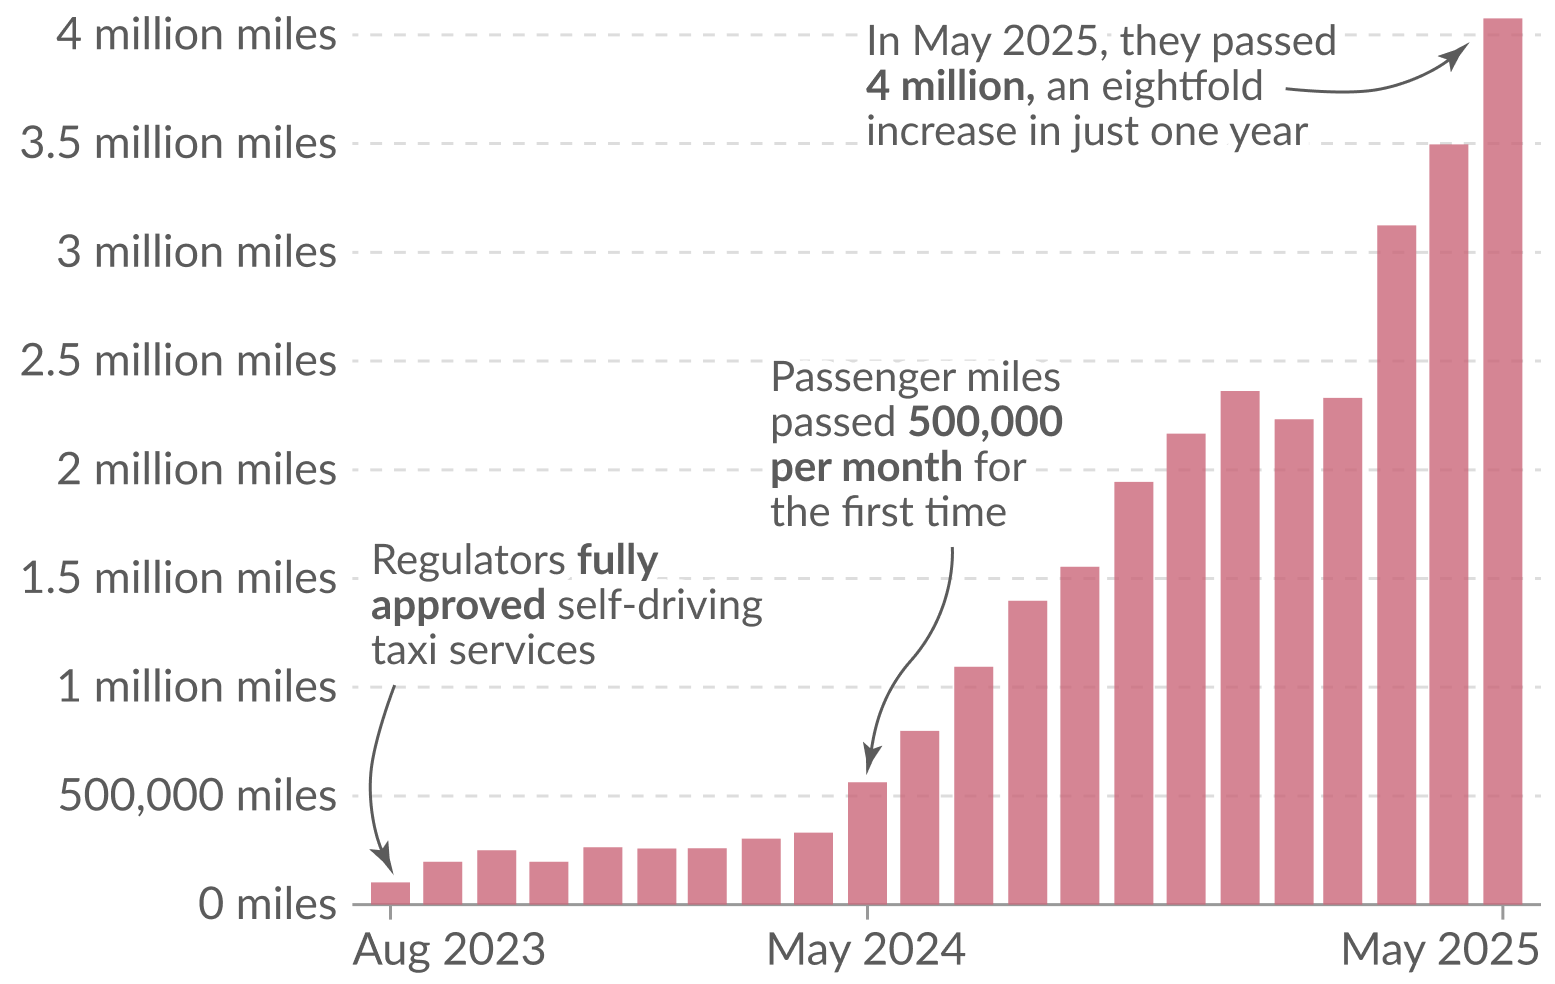
A technology analyst studies the rapid adoption of autonomous vehicles in California. The analyst notes that once regulators fully approved driverless taxi services in 2023, usage expanded at an extraordinary pace. Within months, passenger miles grew from negligible levels to well over half a million per month, and the upward trend showed no signs of slowing. The analyst claims that this pattern illustrates how quickly emerging technologies can achieve mainstream acceptance once regulatory barriers are removed.
Which choice best provides evidence from the graph to support the analyst’s claim?
A. Monthly passenger miles passed 500,000 for the first time in May 2024, less than a year after regulators fully approved driverless taxi services.
B. Driverless taxi usage reached nearly 2 million passenger miles per month by late 2024.
C. In May 2025, monthly passenger miles surpassed 4 million, representing an eightfold increase in just one year.
D. Regulators fully approved self-driving taxi services in August 2023, when monthly usage was still close to zero.
The answer is C. At the far left of the graph, we see the removal of regulation on driverless taxis. We need an answer that uses the information in the graph to describe the exploding growth as we read left to right on the graph. Choice C does that best, speaking of an “eightfold increase.” Choice B might seem tempting, but although it does speak of a larger amount, there’s no comparison to what that amount used to be. On the other hand, choice A notes a change near the beginning, but doesn’t address change as comprehensively as choice C does.
Difficulty 4
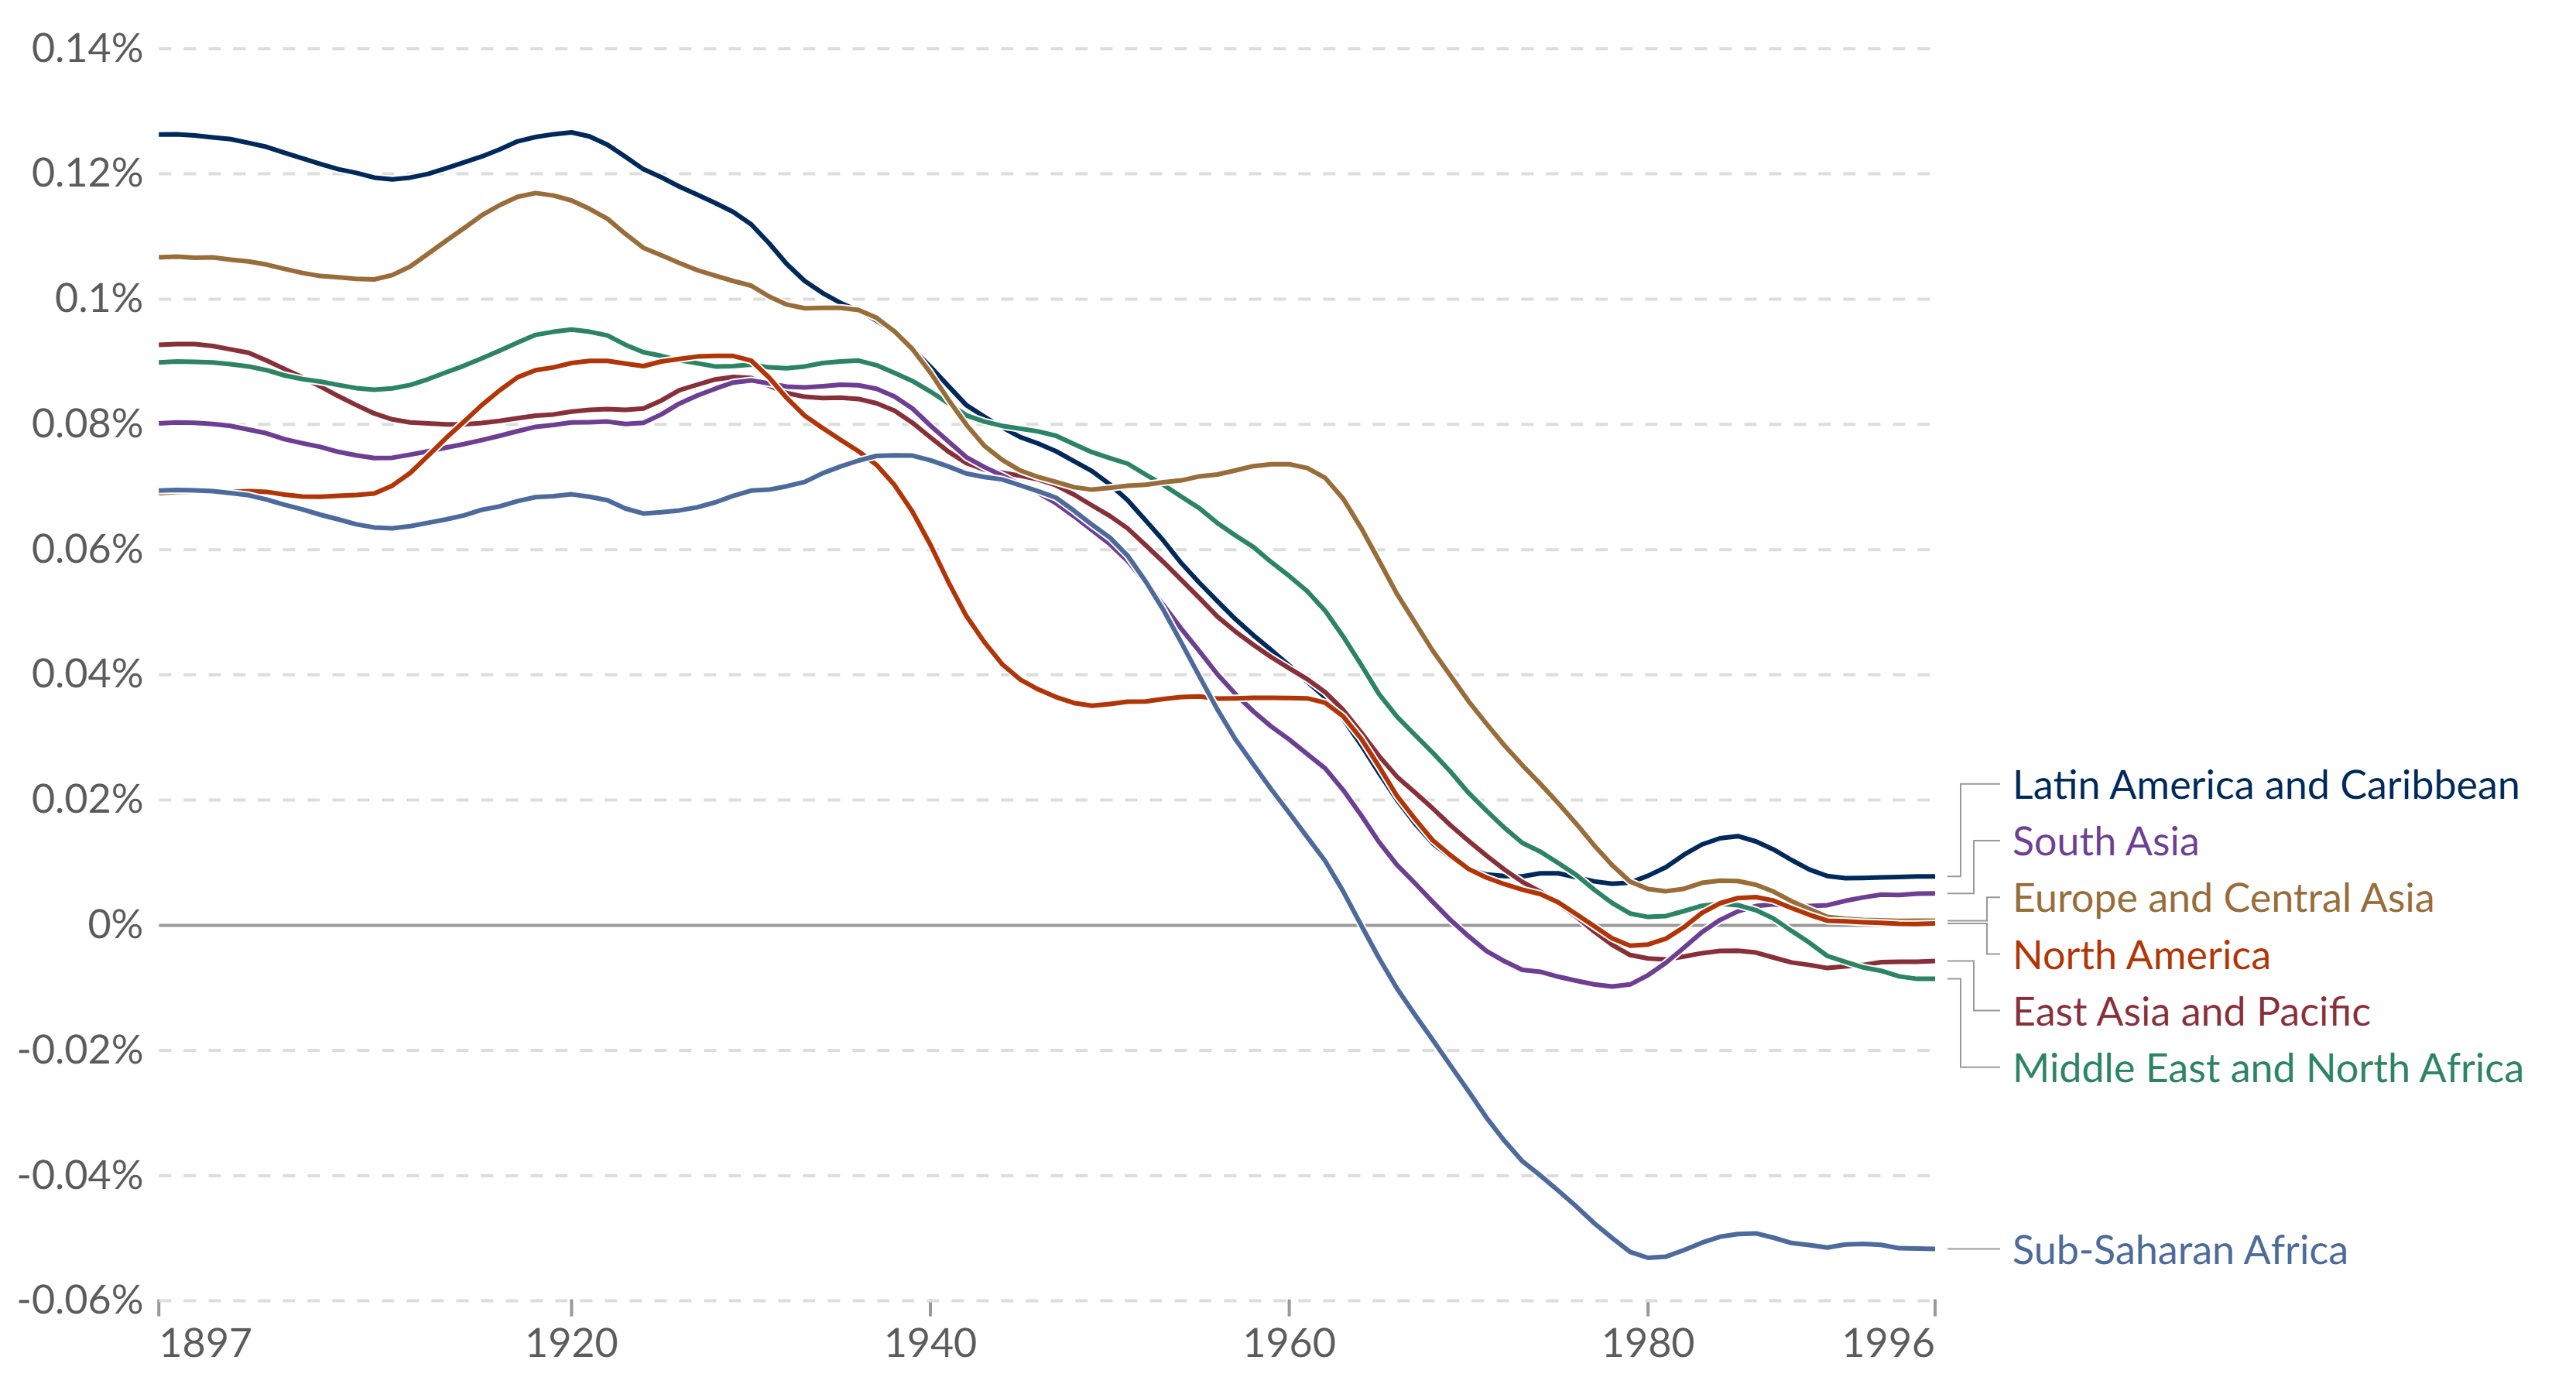
An anthropologist argues that improvements in women’s average height in the twentieth century reflect gains in nutrition and public health, but she notes that these gains slowed and even reversed in some regions by the late twentieth century. She suggests that some regional gains in health may be highly sustainable even if such increases are, on the whole, less dramatic.
Which choice best provides evidence from the graph to support the anthropologist’s claim?
A. In Sub-Saharan Africa, annual increases in female height declined steadily after 1960, eventually becoming negative by the 1980s.
B. In Europe and Central Asia, annual gains in height exceeded 0.1% in the early twentieth century before dropping closer to zero after 1970.
C. In North America, height gains lagged behind those of many other regions in the early 1900’s but no region saw a smaller overall decrease in women’s height gain than did North America.
D. In North America, the rate of annual height increases gradually diminished over the century, with values remaining mostly positive through 1996 after dipping into the negative range briefly around 1980.
The answer is C. As the questions get harder, it becomes all the more important to read carefully the details of the claim being made. The anthropologist’s claim is nuanced: that the gains not necessarily the most dramatic might be nevertheless the most sustainable. We need to make sure our answer illustrates both aspects of this complicated claim.
In looking for a rate of growth that is not the most dramatic but could be the most sustainable, we find that North America stands out. The line marking North America on the graph starts out lower than several of the others, indeed, lower than any except Sub-Saharan Africa. However, although all the lines trend downward overall, North America’s drops the least. This suggests that, all in all, any height gains for North American women may be more sustainable than anywhere else.
Difficulty 5
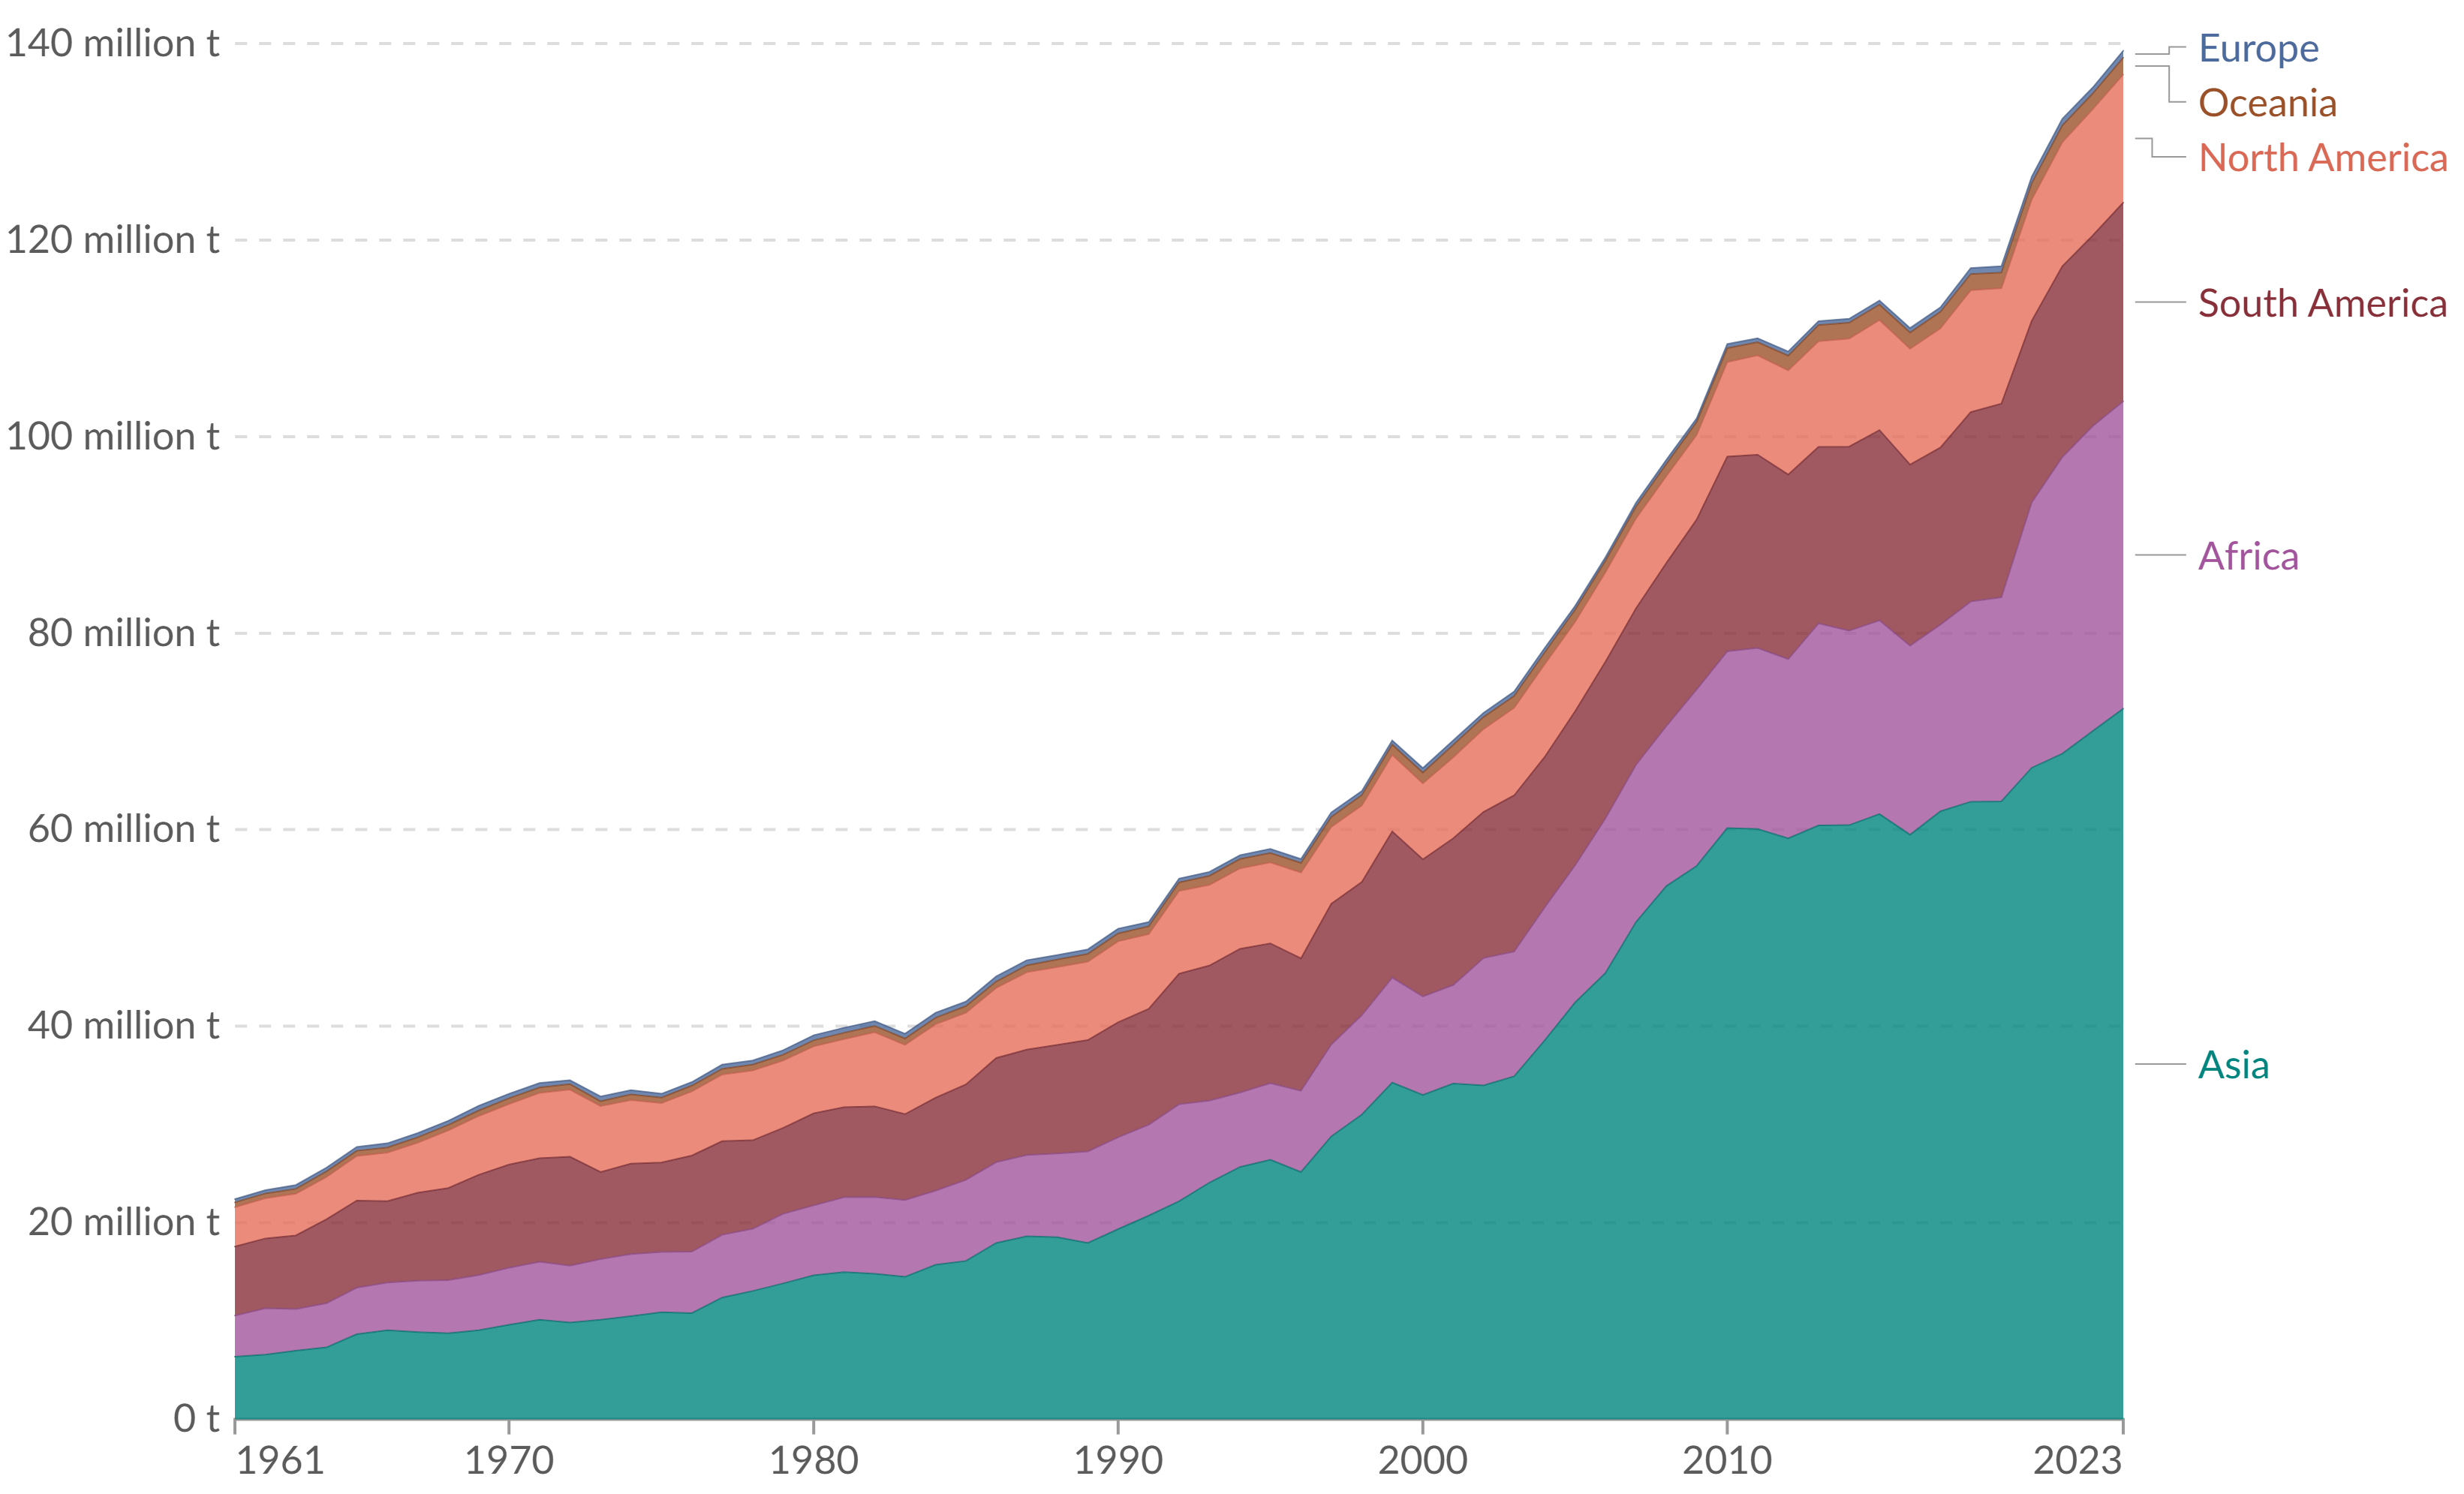
An agricultural economist observes that while global banana production has surged since the 1960s, most of the increase has been driven by a single region. She points out that although Africa and South America have contributed steadily to the overall rise, their combined growth is far less dramatic than that of Asia. According to the economist, the cumulative nature of the global production graph can mask this imbalance, since all regions’ outputs are stacked together. She concludes that presenting data in this “stacking” format may not be the most effective way to communicate relative changes between regions.
Which choice best provides evidence from the graph to illustrate the economist’s claim?
A. By 2023, Asia’s banana production accounted for the largest share of the global total, rising sharply after 1990.
B. South America’s banana production grew consistently throughout the period, but overall banana production rose by a greater rate than did South America’s production.
C. Africa’s production made visible contributions to the global total after 1980, but the precise number of bananas, in the millions, it was contributing yearly by 2023.
D. Since Asia’s results are located at the bottom of the graph, its contribution may appear to be increasing no faster than is the overall total.
The answer is D. If we pay careful attention to the economist’s critical evaluation of “stacking” as a method for displaying this information, we can narrow down the choices quickly to C and D, as those are the two that appear to lament a shortcoming of the graph. Which choice better support’s the focus of the criticism?
The paragraph reveals that the economist wants the graph to successfully display how much more Asia’s production has grown than has any other region’s production.
Choice C doesn’t even mention Asia; in any case, the lack of perfect precision is not really an issue with a graph like this; this kind of graph is not trying to reveal exact numbers as much as to allow the viewer to visually compare large trends. Choice D is much better; it speaks of the difficulty of fully understanding Asia’s dramatic increase in production in this sort of graph.
A final note: you may have noticed that this question asks us to “illustrate” someone’s conclusion from the data rather than “support” it. There is very little difference; the same sort of data that can illustrate (provide an example of) will also tend to support (strengthen the explanation).