Exponential Functions
Introduction
Exponential functions are those in which the input (that is, the independent variable, usually denoted “x”) is an exponent, the power to which a number is raised. If you’ve heard of the phrase “exponential growth” and understand how it means growing by more and more as time goes on, you may understand why, as an exponent grows larger, the value of the function will grow by even larger amounts. There are cases, however, where the value of the function actually decreases exponentially; this is known as exponential decay. We will discuss both concepts in this lesson.
The other theme to this lesson will be the importance of the y-intercept in an exponential function. For now, ask yourself if you remember what is the value of any number raised to the zero power. The answer to that question will be important in this lesson. Consider that a teaser!
Approach Question
The function gives the population of amoebae in an experiment t minutes after initial observation. After how many minutes are there amoebae in the experiment? (Note: this is a free-response question.)
Explanation
To introduce exponential functions, it can be helpful to begin with the basic version of the compound interest formula (taking out the variable , which is used when an investment compounds more than once per year):
A=amount (final)
P=principal (the amount initially deposited)
r=the interest rate, given as a decimal, not a percent
t=the time elapsed, in units given by the problem
Think about and especially. Since is added to 1, any positive will lead to the overall amount growing–and growing all the more as gets larger and larger, since is in the exponential position. For example, if the interest rate were , we would convert that rate to a decimal and identify as . Adding , the amount in parentheses plus the exponent equals . Assuming is at least , the more it grows, the more exponentially the investment grows. Meanwhile, the larger the original amount deposited (), the more initial investment there is to be multiplied repeatedly in the exponential arrangement.
But what if we introduced a “negative rate” to account for an investment decreasing? (Unfortunately, it happens.) What if there was a consistent negative trend in the investment at a rate of per year? In that case, we could assign a value of for . The amount in parentheses would become . What happens when you raise to a power? Plug it into a calculator and see. The higher the power, the lower the number. This is the opposite of exponential growth and is traditionally known as exponential decay (in part because this kind of function is used to model the decay of organic matter, helping scientists date the time at which an organism lived).
This problem does not include exponential decay, though one of the problems in this lesson will. You can recognize the graph of exponential growth by its upward-curving slope, heading toward positive infinity; exponential decay, conversely, slopes downward, flattening out as it approaches (but never quite reaches) zero.
With this explanation in mind, we can explain our Approach question. We know that the initial amount of amoebae, according to the form of an exponential function, is . What does the , which is the base raised to a power, tell us? Remember that the form of the base is , so a base of means that , which points to % growth. Another way of describing % growth is four times as much each unit of time. So this population of amoebae is quadrupling over a certain period of time.
What is that period of time? The exponent is , not just , so this complicates matters. Imagine you plugged in for ; in that case, the power would be equal to . A power of does not change the base at all, so we can infer that minutes is the time it takes for the population to quadruple.
Let’s think about our initial amount and our target amount of . Now that we know the amount is quadrupling in a certain amount of time, we can quadruple the to give us . You may notice that if you quadruple it again, we arrive at our goal of . That means we need two intervals of minutes, or a total of minutes, to finish the job. The answer is 550.
Until now we have explained the problem in logical terms to help you understand what is communicated in an exponential function. But there are actually two other solution strategies that many students will find quicker and more straightforward. The first is to plug in the value of for , since we know that represents some final amount of amoebae. That gives us the following steps:
What is the next step? Students who have covered logarithms in school may appeal to that approach next, but since the SAT never requires knowledge of logarithms, we are not going to explain that approach here. (But feel free to solve it that way if you know how!) Instead, think about the relationship between and . raised to what power equals ? The power of . This means that , and .
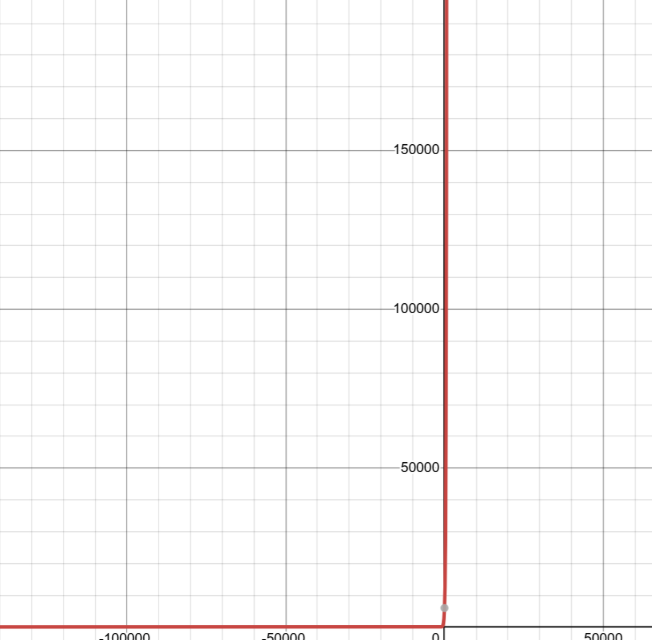
The final way to answer this question is via Desmos. If you graph the function (replacing with and with ), you will see a graph that (if you zoom way out), looks like this:
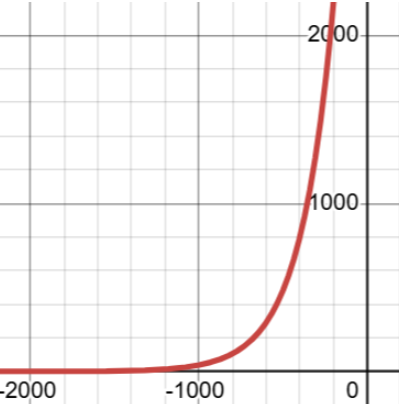
Find where (it may take some moving around with your cursor), and you will see the value of . (In case the image is too zoomed out to see the features of an exponential function, here is a portion of the image that may look more familiar:
In sum, this is a challenging problem because, although there are at least four ways to solve it (logic, logarithms, algebra + logic, and Desmos), none of them is perfectly straightforward. Your best bet is to make sure you understand the purpose and structure of exponential functions, then use a combination of logic, algebra, and graphing with Desmos to approach these problems on test day.
Topics for Cross-Reference
Variations
You may see an exponential function problem “hidden” in a word problem, such as one that suggests a population that doubles every particular unit of time. If the population doubles, that means to represent growth. That means the base of the exponent is . So the in the base represents the doubling in the exponential function.
Flashcard Fodder
- The only flashcard you might want to make for this lesson is the simplified formula for compound interest: .
Sample Questions
Difficulty 1
The number of bacteria in a sample is modeled by the function , where is the number of minutes after initial observation. How many bacteria are in the sample after minutes?
A. 83,250
B. 111,000
C. 124,875
D. 187,313
The answer is 124,875. Exponential equations can look intimidating because of their complicated structure. Fortunately, many problems with these types of equations are simpler than they appear (particularly with the use of a calculator), like this one. We know that =time in this case, so we are called upon to plug in for . The calculator can take it from there, revealing our answer. (The trap answer is , for those who mistakenly think that a time of minutes means we simply double the original population of bacteria.)
Difficulty 2
If the given function f is graphed in the xy-coordinate plane, what is the y-intercept of the graph?
A.
B.
C.
D.
The answer is . The simplest approach may be graphing by Desmos, but before jumping there, it’s worth revisiting what’s noted in the Strategy Insights section about the -intercept. Since the -intercept means that , and since anything to the zero power is , we know that the -intercept is always equal simply to the initial coefficient. In that case, that coefficient is . No graphing necessary, and if you need confirmation, plug the function into your calculator, using for .
Difficulty 3
For an experiment, a scientist created a soil sample in which conditions were held constant and monitored the decomposition of an organism placed in the soil. She found that the organism decomposed at a steady rate of per hour. If the amount remaining of the organism were modeled by a function, what kind of function would it be?
A. Increasing exponential
B. Decreasing exponential
C. Increasing linear
D. Decreasing linear
The answer is Decreasing exponential. This problem can be solved logically through an understanding of how exponential functions work. Since we carefully defined exponential decay above, return there if you need to for full understanding. If you read carefully, you noticed that the action here is “decomposition,” so clearly the model should be decreasing. But is it linear or exponential? We can clarify the case by understanding as a negative rate and therefore equal to in the function. If the decomposition continues at this rate every hour, it is undergoing exponential decay.
Notice how tricky the problem is: it includes the phrase “steady rate,” but even though the rate is steady, the amount of the organism remaining would not be. If it loses of itself every hour, it is progressively losing less and less every hour, because there is less of itself to lose! A difficult (and perhaps slightly gross) thing to imagine, but it’s worth trying to understand the real-life event to make sure you’re conceiving of the question correctly.
Difficulty 4
The first term of a sequence is . Each term after the first term is times the preceding term. Which of the following functions could be used to model the nth term of the sequence?
A.
B.
C.
D.
The answer is . By now, you may be getting used to the idea that the first coefficient you see in an exponential function is the initial amount. This means that our answer here should begin with , and we can eliminate one answer choice. What is happening after the original ? The number is getting continually multiplied by , so seems to make sense.
But wait! There is an additional trap. To see the trap, remember that when we say the “nth term” we are talking about order. If , that’s the first term; if , that’s the second term; and so on. That means that, if we plug in to the correct function, we should arrive at , because is the first term. But if we plug into , we get , not . Why does that happen? It’s because the first term is not itself a multiple of . In other words, the multiplying by hasn’t begun yet when we are at the first term. That means we need to subtract from the in the exponent to show that we’re really multiplying by the previous term. Hence our (very deceiving) answer.
Difficulty 5
The function is defined by the given function. If , which of the following equations describes the function ?
A.
B.
C.
D.
The answer is . The theory behind this question is complicated; we will explain it below, but let’s first propose a solution that doesn’t require understanding the underlying algebra: the “guess and check” approach. Let’s plug in a number for , say , and use the calculator to match the answers. If , then we plug in for there and realize that . So we should plug into the function and into the function in the answers until they match. In the case of both the function and the correct answer, the result is .
Now, for the more technical explanation. Imagine you plug into the original function to create the function, which is then . The question is, how does the power of turn into the power of ? The process involved is, of course, subtraction; if you work backward from your understanding of exponent rules, you may realize that subtraction in exponents comes from dividing bases. In other words, if we want to turn into , we should divide by . This is exactly what the right answer has done; it hasn’t changed the from the function, but instead has divided that function by . Not an easy thing to see, but once this process is clear, so is the correct answer.
Finally, if you are one of those students who are wizards at using and interpreting Desmos, read this paragraph. It is possible to solve this problem by graphing the original function and all of the answers, then comparing what you see. If you think about the question of translation, how changing in parentheses to in parentheses moves the function units to the right, that means the function should be exactly the same shape as the function but shifted units to the right. If you’d like to take the time to try this out on Desmos, that’s exactly what you’ll see!