Duration, volatility, & yield curves
Price volatility
When interest rates change, bond prices in the secondary market change too. Bonds with longer maturities and lower coupons tend to have the most price volatility.
Long maturities
A bond with a long maturity is usually more sensitive to interest rate changes. The key idea is timing: the further away the bond’s cash flows are, the more their value changes when market rates change.
Assume you own a 1-year bond and a 20-year bond. If interest rates rise, the market value of both bonds will fall - but the 20-year bond’s price will fall more. Here’s why.
When interest rates rise, newly issued bonds come to market with higher yields. That makes existing bonds (with lower coupons) less attractive, so their prices must drop to compete.
Both the 1-year and 20-year bond decline in value, but the 1-year bond typically declines less because:
- It matures soon.
- Within one year, the investor receives par value back.
- The investor can then reinvest at the new, higher interest rates.
The 20-year bond doesn’t have that flexibility. The investor is effectively locked into the lower coupon for much longer (unless the bond is sold), so the price has to adjust more to make the bond competitive.
When interest rates fall, the same logic works in reverse. Long-term bonds usually rise more in price because:
- New bonds are issued with lower yields.
- Existing long-term bonds with higher locked-in coupons become more attractive.
In our comparison, the 1-year bond may rise in price, but not by much because it matures soon. The 20-year bond’s higher coupon is locked in for many years, so investors are willing to pay more for it.
Low coupons
Bonds with lower coupons tend to have more price volatility than bonds with higher coupons.
To see why, assume you own two 10-year bonds:
- One has a 2% coupon.
- One has a 10% coupon.
When interest rates rise, the value of both bonds will fall. The 2% coupon bond typically falls further because it pays less interest along the way. With less coupon income coming in, the investor has fewer dollars to reinvest at the new, higher rates.
By contrast, the 10% coupon bond pays more interest each year, giving the bondholder more cash flow to reinvest at the new higher rates. That higher coupon helps reduce the bond’s sensitivity to rising rates.
Another way to think about it: the lower the coupon, the more likely the bond was originally sold at a discount. If much of the bond’s return comes from the discount (the price moving toward par at maturity), the investor has to wait until maturity to realize that part of the return.
When interest rates fall, the value of both bonds will rise. The 2% coupon bond often rises more because:
- A larger portion of its value may be tied to receiving par at maturity.
- It pays less coupon interest along the way, so there’s less cash that would need to be reinvested at the new, lower rates.
The 10% coupon bond pays much more interest. If the bondholder reinvests those coupon payments, they’ll now be reinvesting at lower rates. That reinvestment effect makes the high-coupon bond relatively less valuable when rates fall.
Here’s a video breakdown of a practice question regarding price volatility:
Duration
The concept of duration is closely related to price volatility. In general, the debt security with the longest maturity and the lowest coupon will have the highest duration.
Duration is unique because it captures two related ideas:
- How sensitive a bond’s price is to interest rate changes
- How long it takes (in time terms) for an investor to recoup the bond’s cost through its cash flows
For example, assume we’re analyzing the following bond:
20 year, $1,000 par, 10% debenture trading for 120
This bond pays $100 in annual interest (10% of $1,000) for 20 years. It currently costs $1,200 (trading at 120% of $1,000)*.
*If the bond quote above is confusing, please revisit this chapter to review.
If the bond pays $100 per year and costs $1,200, how long will it take to recoup the original cost? If we assume the interest is not reinvested*, it will take about 12 years:
- $100 per year × 12 years = $1,200
So, the duration of this debenture is roughly 12 years.
*Duration calculations often assume future cash flows are discounted to present value and reinvested. The details are not important for test purposes, but we’re calling this out because the duration calculation above is very oversimplified. However, test questions tend to focus on the fundamental concepts of duration. Know the basics and you’ll be fine!
Now, assume we’re analyzing this bond:
20-year, $1,000 par, zero coupon bond trading for 45
This bond does not pay interest until maturity (same with all zero coupon bonds), which is in 20 years. It currently costs $450 (trading at 45% of $1,000).
Because a zero coupon bond pays no interest until the end, the investor doesn’t receive any cash flows until maturity. That means it takes the full life of the bond to recoup the investment. Another way to say this is:
- A zero coupon bond’s duration equals its maturity.
So, this bond’s duration is 20 years.
Let’s compare the two bonds:
20 year, $1,000 par, 10% debenture trading for 120
- Duration = 12 years
20-year, $1,000 par, zero coupon bond trading for 45
- Duration = 20 years
Duration and price volatility move together: longer maturity and lower coupon generally mean higher price volatility and longer duration. These two bonds fit that pattern. Both have 20-year maturities, but the zero coupon bond has greater price sensitivity and a longer duration.
Yield curves
Price volatility and duration help predict how bond prices respond to interest rate changes. Another tool for understanding the bond market is the yield curve, which shows the yields of similar debt securities across different maturities. For example:
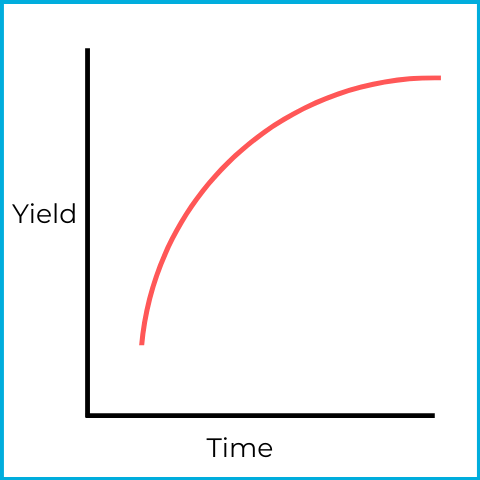
This is a normal (ascending) yield curve. Short-term securities have lower yields, and long-term securities have higher yields. Longer maturities usually carry more risk exposure, so investors typically demand higher yields.
Sometimes the yield curve reflects unusual market conditions. For example:
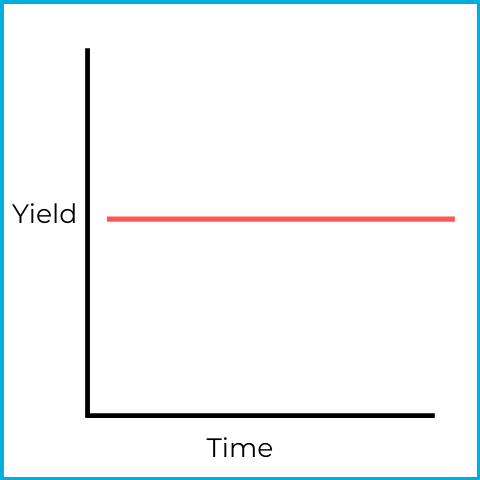
This is a flat yield curve, which often signals uncertainty. Short-term and long-term debt securities have similar yields, which is not typical.
One way a flat curve can develop is if investors sell short-term securities and buy long-term bonds:
- Lower demand for short-term securities pushes their prices down and yields up.
- Higher demand for long-term bonds pushes their prices up and yields down.
Those combined moves flatten the curve.
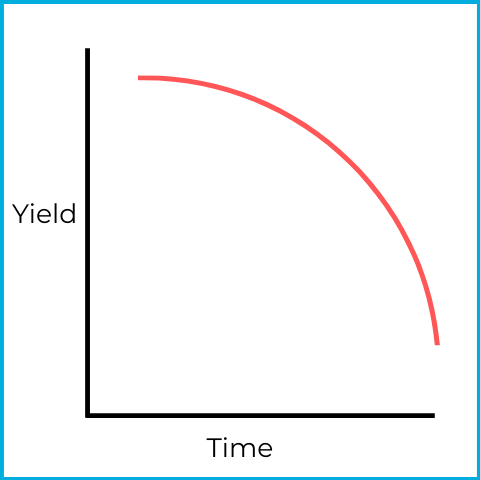
This is an inverted (descending) yield curve, which can indicate a pending economic recession (declining economic activity). Short-term debt securities have higher yields than long-term debt securities.
An inverted curve can be viewed as an extension of the same forces that can produce a flat curve (flat occurs first, then it inverts). If investors expect a recession, they may liquidate short-term debt securities and buy long-term bonds.
Investors can find yield curves for many segments of the bond market, including curves for specific types of securities (corporate, municipal, US Government, etc.). There are also comparative yield curves, sometimes called credit yield spreads, that compare two yield curves. A common comparison is US government vs. corporate yield curves.
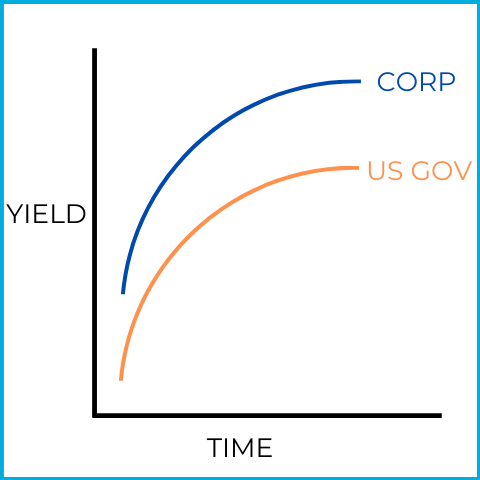
Corporate debt securities typically have higher yields than US Government securities, mainly because corporate bonds carry more risk. Comparative yield curves focus on the distance between the two curves.
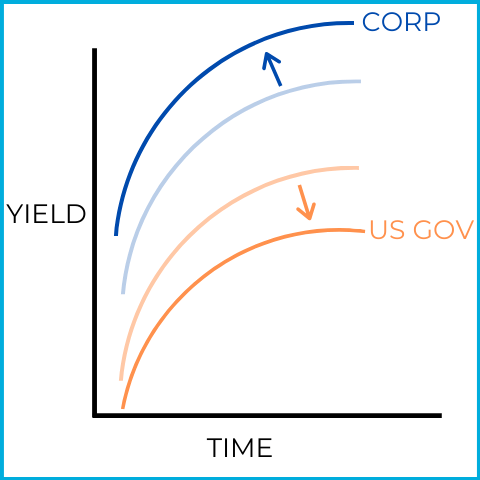
In this picture, the yield curves widen (move further apart), signaling an economic recession. Investors are liquidating riskier corporate investments and buying safer US government securities:
- Decreased demand for corporate bonds lowers prices and raises yields.
- Increased demand for US government bonds raises prices and lowers yields.
This shift toward safety is why a widening yield curve can be a sign of an upcoming recession.
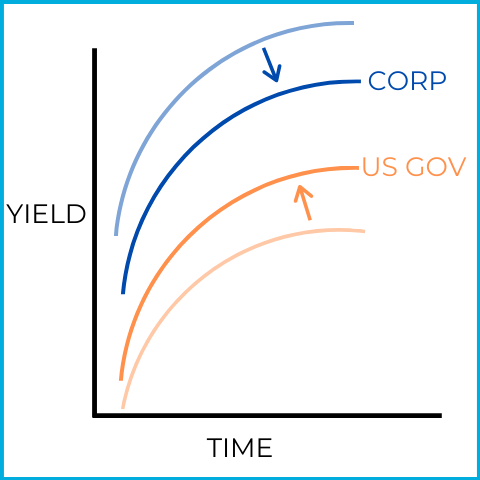
In this picture, the yield curves narrow (move closer together), signaling economic prosperity (expansion). Investors are liquidating safer US government bonds and buying riskier corporate bonds:
- Increased demand for corporate securities raises prices and lowers yields.
- Decreased demand for US Government bonds lowers prices and raises yields.
This shift toward risk is why a narrowing yield curve can be a sign of economic prosperity.