



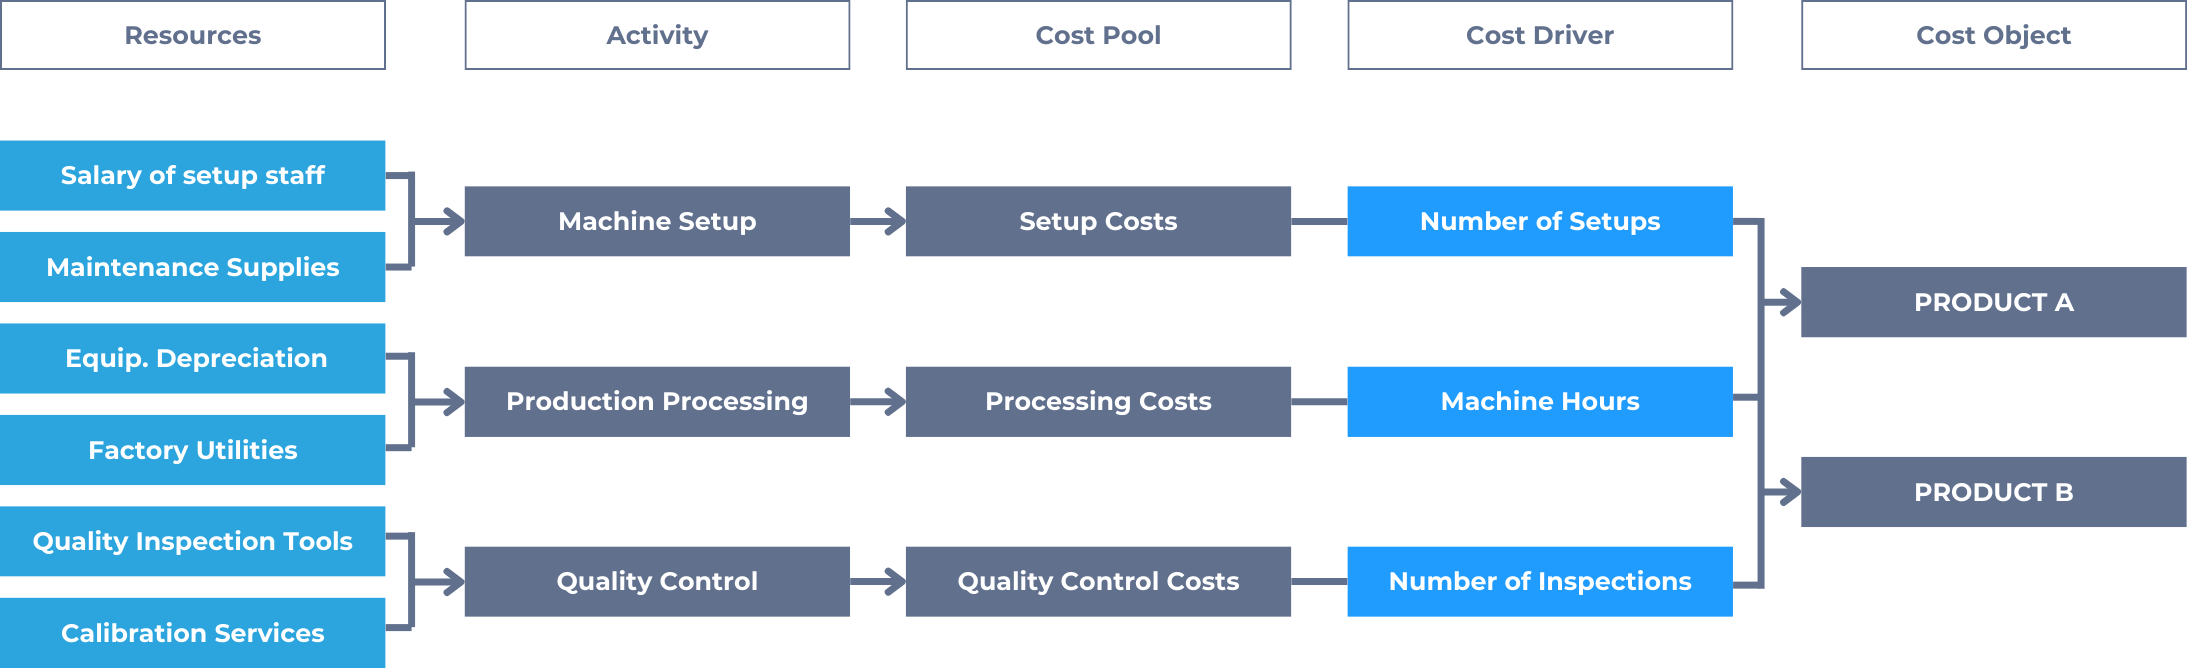
ABC: cost flows and product costing
Cost flows in Activity-Based Costing
In an Activity-Based Costing (ABC) system, the flow of costs differs significantly from traditional costing. Rather than assigning overhead directly to products based on a single driver like direct labor hours, ABC traces costs more accurately by linking the following:
This multi-stage allocation provides a clearer picture of how and why overhead costs are incurred, enabling more accurate product costing, better pricing decisions, and enhanced cost control.
Step-by-Step flow of costs in ABC
ABC cost flow consists of two stages of allocation:
Stage 1: Assign Resource Costs to Activities (Resource Drivers)
Costs such as salaries, rent, utilities, and depreciation are first accumulated into activity cost pools. These are grouped by activity type (e.g., machine setups, inspections, order processing). Allocation is based on resource drivers, which measure how much of each resource is consumed by an activity.
Example:
- Factory rent and machine depreciation are assigned to the “Machine Operation” cost pool based on machine hours.
- HR salaries are assigned to the “Employee Training” pool based on number of hours devoted.
Stage 2: Assign Activity Costs to Cost Objects (Activity Drivers)
Once activity cost pools are established, costs are assigned to specific cost objects (such as products, services, or customers) using activity drivers that best represent consumption.
Example:
- Setup costs are allocated based on number of setups per product
- Inspection costs are allocated based on number of batches inspected
- Customer support costs may be allocated based on number of service calls
Comparison to traditional cost flow
The following table shows the difference to ABC versus the traditional costing which we have discussed so far:
| Step | Traditional Costing | Activity-Based Costing (ABC) |
| Overhead Pool | Usually single or few pools | Multiple activity-based pools |
| Allocation Base | Typically volume-based (e.g., labor hours) | Activity-based (e.g., # of setups, # of orders) |
| Accuracy of Allocation | Less accurate, may distort product costs | High accuracy, especially for complex product lines |
| Flexibility | Rigid, less adaptable to change | Flexible, accommodates diverse operations and services |
Strategic insight
ABC reveals which activities drive costs and which products or services consume the most resources. This visibility supports decisions such as:
- Identifying non-value-added activities
- Improving process efficiency
- Pricing high-complexity products more accurately
- Re-evaluating customer or channel profitability
ABC product costing calculations
In Activity-Based Costing (ABC), overhead costs are assigned to products based on the actual activities that each product consumes. This approach provides a more nuanced and accurate reflection of resource usage than traditional costing. It is important to note that direct materials and direct labor continue to be traced directly to products even under ABC. The main distinction lies in the way indirect (overhead) costs are allocated.
Below is a comprehensive example showing how overhead is assigned to two products using ABC:
The Company produces two types of products
- Product A
- Product B
Overhead Cost Pools and Activity Drivers are as follows:
| Cost Pool | Total Overhead | Activity Driver | Product A Usage | Product B Usage |
| Machine | $60,000 | Machine hours | 1,200 hours | 800 hours |
| Assembly | $40,000 | Direct labor hours | 500 hours | 1,000 hours |
| Dispatch | $30,000 | Number of orders | 150 orders | 150 orders |
| Inspection | $20,000 | Number of inspections | 100 inspections | 300 inspections |
Step 1: calculate activity rates
| Cost Pool | Total Overhead | Total Activity | Activity Rate |
| Machine | $60,000 | 2,000 machine hours | $30 per machine hour |
| Assembly | $40,000 | 1,500 labor hours | $26.67 per labor hour |
| Dispatch | $30,000 | 300 orders | $100 per order |
| Inspection | $20,000 | 400 inspections | $50 per inspection |
Step 2: assign overhead to products
| Cost Pool | Product A Usage | Rate | Overhead for A | Product B Usage | Overhead for B |
| Machine | 1,200 hours | $30/hour | $36,000 | 800 hours | $24,000 |
| Assembly | 500 hours | $26.67/hour | $13,335 | 1,000 hours | $26,670 |
| Dispatch | 150 orders | $100/order | $15,000 | 150 orders | $15,000 |
| Inspection | 100 inspections | $50/inspection | $5,000 | 300 inspections | $15,000 |
Step 3: Total overhead allocation
| Product | Total Overhead Assigned |
| Product A | $36,000 + $13,335 + $15,000 + $5,000 = $69,335 |
| Product B | $24,000 + $26,670 + $15,000 + $15,000 = $80,670 |
This example illustrates how ABC allocates overhead more accurately by associating it with actual activities and resource consumption. For instance:
- Product A used more machine time and incurred higher machine-related costs.
- Product B required more inspections and assembly labor, leading to greater cost in those pools.
If a traditional volume-based allocation (e.g., by labor hours alone) had been used, these nuanced differences in overhead usage might have been overlooked, leading to cross-subsidization and misstated product profitability.