

This browser is too old to run Achievable.

Update it, or open this page in a current version of Chrome, Safari, Firefox or Edge. On an iPhone or iPad, update iOS: every browser there runs on the version of Safari that comes with it.

Achievable logoAchievable logo
CMA Part 1
Sign in
Sign up
Purchase
Textbook
Practice exams
Support
How it works
Resources
Exam catalog
Mountain with a flag at the peak
Textbook
Introduction
1. External financial reporting decisions
2. Planning, budgeting, and forecasting
3. Performance management
4. Cost management
5. Internal control
6. Technology and analytics
Wrapping up
Achievable logoAchievable logo
4.2.2.2 ABC: cost flows and product costing
Achievable CMA Part 1
4. Cost management
4.2. Costing systems
4.2.2. Activity-based costing (ABC)
Our CMA Part 1 course is currently in development and is a work-in-progress.

ABC: cost flows and product costing

8 min read
Font
Discuss
Share
Feedback

Cost flows in Activity-Based Costing

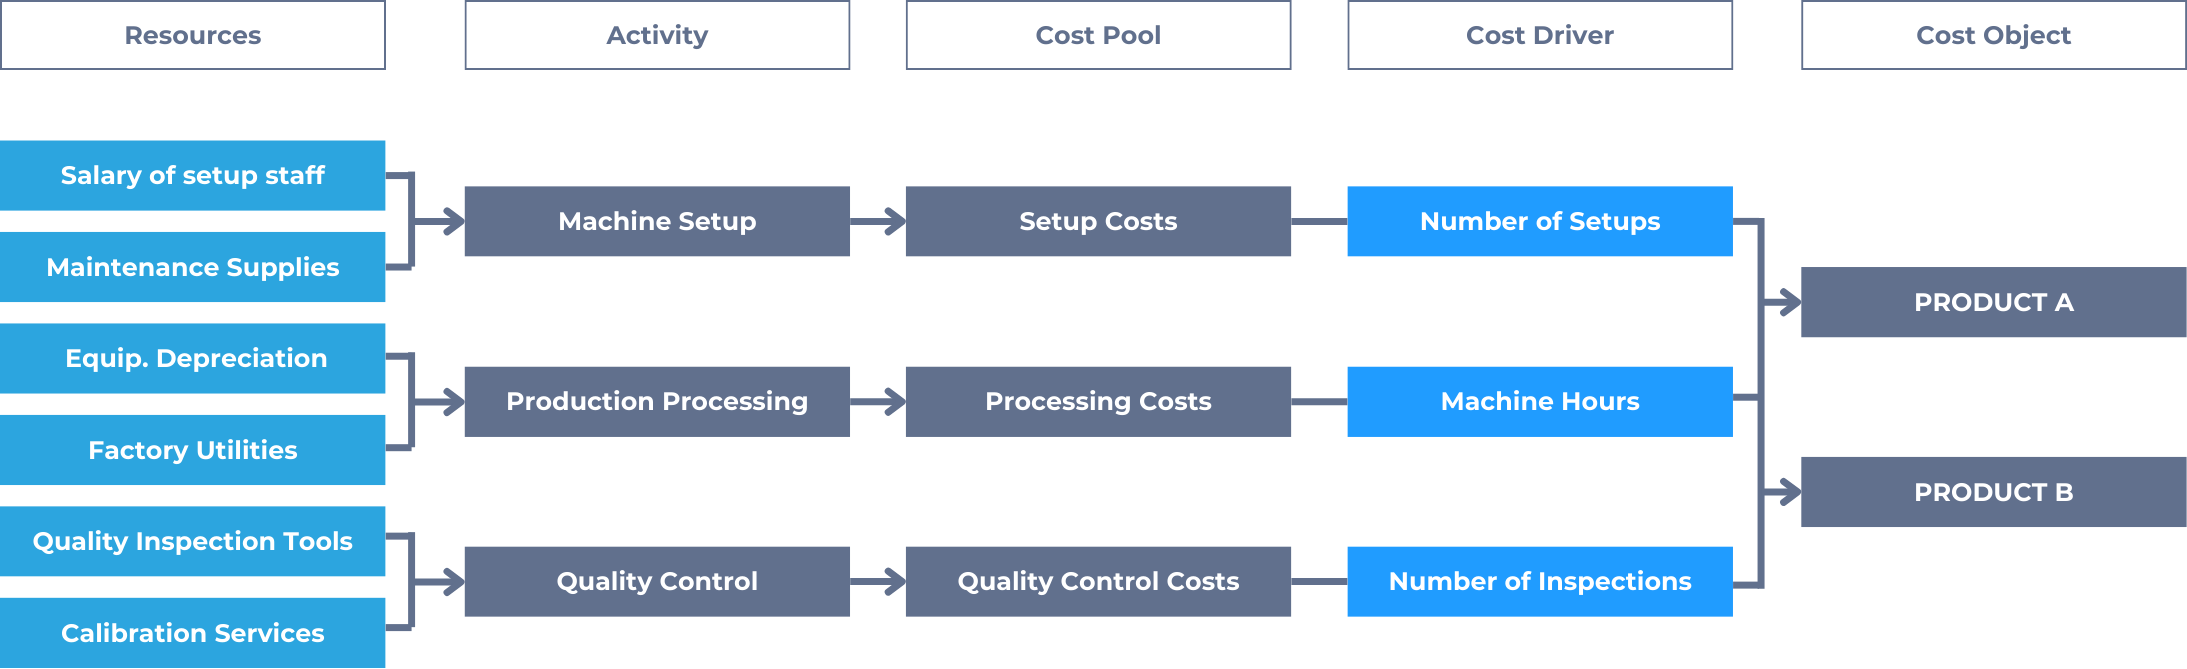
In an Activity-Based Costing (ABC) system, the flow of costs differs significantly from traditional costing. Rather than assigning overhead directly to products based on a single driver like direct labor hours, ABC traces costs more accurately by linking resources (the costs a company incurs) to activities through resource drivers, and then linking those activities to cost objects such as products, services, or customers through activity drivers.

Cost flows in ABC
Cost flows in ABC
Achievable

This multi-stage allocation provides a clearer picture of how and why overhead costs are incurred, enabling more accurate product costing, better pricing decisions, and enhanced cost control.

Step-by-Step flow of costs in ABC

ABC cost flow consists of two stages of allocation:

Stage 1: Assign Resource Costs to Activities (Resource Drivers)

Costs such as salaries, rent, utilities, and depreciation are first accumulated into activity cost pools. These are grouped by activity type (e.g., machine setups, inspections, order processing). Allocation is based on resource drivers, which measure how much of each resource is consumed by an activity.

Example:

  • Factory rent is assigned to the “Machine Operation” pool based on square footage occupied, and maintenance staff salaries are assigned based on the share of labor time spent on machine upkeep.
  • HR salaries are assigned to the “Employee Training” pool based on number of hours devoted.
  • To see the resource-driver math directly: if $100,000 of factory rent is split by square footage, with 60% of the floor used for machine operation and 40% for training, $60,000 goes to the Machine Operation pool and $40,000 goes to the Employee Training pool.

Stage 2: Assign Activity Costs to Cost Objects (Activity Drivers)

Once activity cost pools are established, costs are assigned to specific cost objects (such as products, services, or customers) using activity drivers that best represent consumption.

Example:

  • Setup costs are allocated based on number of setups per product
  • Inspection costs are allocated based on number of batches inspected
  • Customer support costs may be allocated based on number of service calls

ABC activity pools generally fall into a cost hierarchy, which explains why some overhead is easier to trace accurately than others:

  • Unit-level activities: vary with each unit produced, such as machine hours consumed per unit.
  • Batch-level activities: vary with each batch processed rather than each unit, such as setups and inspections performed per batch.
  • Product-sustaining activities: support a specific product line regardless of how many units or batches are produced, such as engineering changes for that line.
  • Facility-level activities: support the overall production process and can’t be traced to any specific product, batch, or line, such as plant rent and the plant manager’s salary.

Facility-level costs have no causal driver linking them to specific cost objects, which is why they’re still allocated somewhat arbitrarily even under ABC.

Comparison to traditional cost flow

The following table compares ABC with the traditional costing discussed so far:

Step Traditional Costing Activity-Based Costing (ABC)
Overhead Pool Usually single or few pools Multiple activity-based pools
Allocation Base Typically volume-based (e.g., labor hours) Activity-based (e.g., # of setups, # of orders)
Accuracy of Allocation Less accurate, may distort product costs Generally more accurate, especially for complex product lines
Flexibility Rigid, less adaptable to change Flexible, accommodates diverse operations and services
Cost to implement Low; simple to maintain High; needs detailed activity data and judgment in choosing drivers.
  • Facility-level costs are still allocated somewhat arbitrarily, since they have no causal driver linking them to products.
  • Generally worth the added cost when overhead is a large share of total cost or product lines are diverse.
  • Often not worth it for simple, low-overhead, single-product operations.

ABC can also be applied outside manufacturing - a hospital, for example, might assign overhead to patient visits using activity drivers like number of lab tests or minutes of nursing care.

Strategic insight

ABC reveals which activities drive costs and which products or services consume the most resources. This visibility supports decisions such as identifying non-value-added activities and re-evaluating customer or channel profitability.

A value-added activity directly contributes to the value a customer perceives in a product or service, such as machining or assembly. A non-value-added activity consumes resources without adding that value, such as inspection or rework; ABC’s activity pools make these costs visible so managers can target them for reduction.

ABC product costing calculations

Direct materials and direct labor continue to be traced directly to products even under ABC. The main distinction lies in the way indirect (overhead) costs are allocated.

Below is a comprehensive example showing how overhead is assigned to two products using ABC:

The Company produces two types of products

  • Product A
  • Product B

Overhead Cost Pools and Activity Drivers are as follows:

Cost Pool Total Overhead Activity Driver Product A Usage Product B Usage
Machine $60,000 Machine hours 1,200 hours 800 hours
Assembly $40,000 Direct labor hours 500 hours 1,000 hours
Dispatch $30,000 Number of orders 150 orders 150 orders
Inspection $20,000 Number of inspections 100 inspections 300 inspections

Step 1: calculate activity rates

Cost Pool Total Overhead Total Activity Activity Rate
Machine $60,000 2,000 machine hours $30 per machine hour
Assembly $40,000 1,500 labor hours $26.667 per labor hour
Dispatch $30,000 300 orders $100 per order
Inspection $20,000 400 inspections $50 per inspection

Note: the assembly rate is carried unrounded ($40,000 ÷ 1,500 = $26⅔ per hour, shown rounded as $26.667) when it’s applied below, so the overhead assigned across both products adds back up to the full $150,000 pool total.

Step 2: assign overhead to products

Cost Pool Product A Usage Rate Overhead for A Product B Usage Overhead for B
Machine 1,200 hours $30/hour $36,000 800 hours $24,000
Assembly 500 hours $26.667/hour $13,333 1,000 hours $26,667
Dispatch 150 orders $100/order $15,000 150 orders $15,000
Inspection 100 inspections $50/inspection $5,000 300 inspections $15,000

Step 3: Total overhead allocation

Product Total Overhead Assigned
Product A $36,000 + $13,333 + $15,000 + $5,000 = $69,333
Product B $24,000 + $26,667 + $15,000 + $15,000 = $80,667

This example illustrates how ABC allocates overhead more accurately by associating it with actual activities and resource consumption.

To see the effect of this concretely, compare these ABC results to a traditional, volume-based allocation that uses direct labor hours as the single overhead driver. The plantwide rate would be $150,000 total overhead ÷ 1,500 total direct labor hours = $100 per direct labor hour. That assigns $50,000 of overhead to Product A (500 hours × $100) and $100,000 to Product B (1,000 hours × $100).

Compared with the ABC results of $69,333 for Product A and $80,667 for Product B, traditional costing undercosts Product A by $19,333 and overcosts Product B by that same $19,333. Total overhead allocated is unchanged either way - only how it’s divided between the two products differs. That shift is exactly the cross-subsidization ABC is designed to correct.

ABC cost flow structure

  • Two-stage allocation: Stage 1 assigns resource costs to activity cost pools via resource drivers (e.g., rent by square footage); Stage 2 assigns pooled activity costs to cost objects via activity drivers (e.g., setups, orders, inspections)
  • More accurate than traditional costing because it links costs to the activities that actually cause them

Cost hierarchy

  • Unit-level: varies per unit (e.g., machine hours)
  • Batch-level: varies per batch (e.g., setups, inspections)
  • Product-sustaining: supports a product line regardless of volume (e.g., engineering changes)
  • Facility-level: supports overall operations, not traceable to any object (e.g., plant rent); still allocated somewhat arbitrarily even in ABC

ABC vs. traditional costing

  • Traditional: single/few pools, volume-based driver (e.g., labor hours), simple but less accurate, can distort costs
  • ABC: multiple activity pools, varied drivers, more accurate especially for diverse products, but costlier/more complex to implement
  • ABC worth it when overhead is large or product lines diverse; not worth it for simple, low-overhead operations
  • Applicable beyond manufacturing (e.g., hospitals allocating overhead via lab tests, nursing minutes)

Strategic insight

  • ABC reveals true cost drivers, helping identify non-value-added activities (e.g., inspection, rework) vs. value-added activities (e.g., machining, assembly)
  • Supports better pricing, cost control, and profitability analysis by product/customer

ABC calculation steps

  • Step 1: Compute activity rate = total overhead in pool ÷ total activity driver volume (e.g., $60,000 ÷ 2,000 machine hours = $30/hour)
  • Step 2: Multiply each product’s usage by the activity rate to assign overhead per pool
  • Step 3: Sum overhead across all pools per product for total allocated overhead
  • Direct materials and direct labor are still traced directly; only overhead allocation method changes

ABC vs. traditional allocation impact

  • Traditional (single volume-based rate, e.g., direct labor hours) can significantly under- or over-cost products compared to ABC
  • Total overhead allocated stays the same either way — only the distribution between products changes
  • This distortion correction (avoiding cross-subsidization between high/low-overhead products) is the core value of ABC

Sign up for free to take 14 quiz questions on this topic

Previous
Next  | 4.2.2.3 ABC: impact on inventory, COGS, and decision-making
All rights reserved ©2016 - 2026 Achievable, Inc.

ABC: cost flows and product costing

Cost flows in Activity-Based Costing

In an Activity-Based Costing (ABC) system, the flow of costs differs significantly from traditional costing. Rather than assigning overhead directly to products based on a single driver like direct labor hours, ABC traces costs more accurately by linking resources (the costs a company incurs) to activities through resource drivers, and then linking those activities to cost objects such as products, services, or customers through activity drivers.

This multi-stage allocation provides a clearer picture of how and why overhead costs are incurred, enabling more accurate product costing, better pricing decisions, and enhanced cost control.

Step-by-Step flow of costs in ABC

ABC cost flow consists of two stages of allocation:

Stage 1: Assign Resource Costs to Activities (Resource Drivers)

Costs such as salaries, rent, utilities, and depreciation are first accumulated into activity cost pools. These are grouped by activity type (e.g., machine setups, inspections, order processing). Allocation is based on resource drivers, which measure how much of each resource is consumed by an activity.

Example:

  • Factory rent is assigned to the “Machine Operation” pool based on square footage occupied, and maintenance staff salaries are assigned based on the share of labor time spent on machine upkeep.
  • HR salaries are assigned to the “Employee Training” pool based on number of hours devoted.
  • To see the resource-driver math directly: if $100,000 of factory rent is split by square footage, with 60% of the floor used for machine operation and 40% for training, $60,000 goes to the Machine Operation pool and $40,000 goes to the Employee Training pool.

Stage 2: Assign Activity Costs to Cost Objects (Activity Drivers)

Once activity cost pools are established, costs are assigned to specific cost objects (such as products, services, or customers) using activity drivers that best represent consumption.

Example:

  • Setup costs are allocated based on number of setups per product
  • Inspection costs are allocated based on number of batches inspected
  • Customer support costs may be allocated based on number of service calls

ABC activity pools generally fall into a cost hierarchy, which explains why some overhead is easier to trace accurately than others:

  • Unit-level activities: vary with each unit produced, such as machine hours consumed per unit.
  • Batch-level activities: vary with each batch processed rather than each unit, such as setups and inspections performed per batch.
  • Product-sustaining activities: support a specific product line regardless of how many units or batches are produced, such as engineering changes for that line.
  • Facility-level activities: support the overall production process and can’t be traced to any specific product, batch, or line, such as plant rent and the plant manager’s salary.

Facility-level costs have no causal driver linking them to specific cost objects, which is why they’re still allocated somewhat arbitrarily even under ABC.

Comparison to traditional cost flow

The following table compares ABC with the traditional costing discussed so far:

Step Traditional Costing Activity-Based Costing (ABC)
Overhead Pool Usually single or few pools Multiple activity-based pools
Allocation Base Typically volume-based (e.g., labor hours) Activity-based (e.g., # of setups, # of orders)
Accuracy of Allocation Less accurate, may distort product costs Generally more accurate, especially for complex product lines
Flexibility Rigid, less adaptable to change Flexible, accommodates diverse operations and services
Cost to implement Low; simple to maintain High; needs detailed activity data and judgment in choosing drivers.
  • Facility-level costs are still allocated somewhat arbitrarily, since they have no causal driver linking them to products.
  • Generally worth the added cost when overhead is a large share of total cost or product lines are diverse.
  • Often not worth it for simple, low-overhead, single-product operations.

ABC can also be applied outside manufacturing - a hospital, for example, might assign overhead to patient visits using activity drivers like number of lab tests or minutes of nursing care.

Strategic insight

ABC reveals which activities drive costs and which products or services consume the most resources. This visibility supports decisions such as identifying non-value-added activities and re-evaluating customer or channel profitability.

A value-added activity directly contributes to the value a customer perceives in a product or service, such as machining or assembly. A non-value-added activity consumes resources without adding that value, such as inspection or rework; ABC’s activity pools make these costs visible so managers can target them for reduction.

ABC product costing calculations

Direct materials and direct labor continue to be traced directly to products even under ABC. The main distinction lies in the way indirect (overhead) costs are allocated.

Below is a comprehensive example showing how overhead is assigned to two products using ABC:

The Company produces two types of products

  • Product A
  • Product B

Overhead Cost Pools and Activity Drivers are as follows:

Cost Pool Total Overhead Activity Driver Product A Usage Product B Usage
Machine $60,000 Machine hours 1,200 hours 800 hours
Assembly $40,000 Direct labor hours 500 hours 1,000 hours
Dispatch $30,000 Number of orders 150 orders 150 orders
Inspection $20,000 Number of inspections 100 inspections 300 inspections

Step 1: calculate activity rates

Cost Pool Total Overhead Total Activity Activity Rate
Machine $60,000 2,000 machine hours $30 per machine hour
Assembly $40,000 1,500 labor hours $26.667 per labor hour
Dispatch $30,000 300 orders $100 per order
Inspection $20,000 400 inspections $50 per inspection

Note: the assembly rate is carried unrounded ($40,000 ÷ 1,500 = $26⅔ per hour, shown rounded as $26.667) when it’s applied below, so the overhead assigned across both products adds back up to the full $150,000 pool total.

Step 2: assign overhead to products

Cost Pool Product A Usage Rate Overhead for A Product B Usage Overhead for B
Machine 1,200 hours $30/hour $36,000 800 hours $24,000
Assembly 500 hours $26.667/hour $13,333 1,000 hours $26,667
Dispatch 150 orders $100/order $15,000 150 orders $15,000
Inspection 100 inspections $50/inspection $5,000 300 inspections $15,000

Step 3: Total overhead allocation

Product Total Overhead Assigned
Product A $36,000 + $13,333 + $15,000 + $5,000 = $69,333
Product B $24,000 + $26,667 + $15,000 + $15,000 = $80,667

This example illustrates how ABC allocates overhead more accurately by associating it with actual activities and resource consumption.

To see the effect of this concretely, compare these ABC results to a traditional, volume-based allocation that uses direct labor hours as the single overhead driver. The plantwide rate would be $150,000 total overhead ÷ 1,500 total direct labor hours = $100 per direct labor hour. That assigns $50,000 of overhead to Product A (500 hours × $100) and $100,000 to Product B (1,000 hours × $100).

Compared with the ABC results of $69,333 for Product A and $80,667 for Product B, traditional costing undercosts Product A by $19,333 and overcosts Product B by that same $19,333. Total overhead allocated is unchanged either way - only how it’s divided between the two products differs. That shift is exactly the cross-subsidization ABC is designed to correct.

Key points

ABC cost flow structure

  • Two-stage allocation: Stage 1 assigns resource costs to activity cost pools via resource drivers (e.g., rent by square footage); Stage 2 assigns pooled activity costs to cost objects via activity drivers (e.g., setups, orders, inspections)
  • More accurate than traditional costing because it links costs to the activities that actually cause them

Cost hierarchy

  • Unit-level: varies per unit (e.g., machine hours)
  • Batch-level: varies per batch (e.g., setups, inspections)
  • Product-sustaining: supports a product line regardless of volume (e.g., engineering changes)
  • Facility-level: supports overall operations, not traceable to any object (e.g., plant rent); still allocated somewhat arbitrarily even in ABC

ABC vs. traditional costing

  • Traditional: single/few pools, volume-based driver (e.g., labor hours), simple but less accurate, can distort costs
  • ABC: multiple activity pools, varied drivers, more accurate especially for diverse products, but costlier/more complex to implement
  • ABC worth it when overhead is large or product lines diverse; not worth it for simple, low-overhead operations
  • Applicable beyond manufacturing (e.g., hospitals allocating overhead via lab tests, nursing minutes)

Strategic insight

  • ABC reveals true cost drivers, helping identify non-value-added activities (e.g., inspection, rework) vs. value-added activities (e.g., machining, assembly)
  • Supports better pricing, cost control, and profitability analysis by product/customer

ABC calculation steps

  • Step 1: Compute activity rate = total overhead in pool ÷ total activity driver volume (e.g., $60,000 ÷ 2,000 machine hours = $30/hour)
  • Step 2: Multiply each product’s usage by the activity rate to assign overhead per pool
  • Step 3: Sum overhead across all pools per product for total allocated overhead
  • Direct materials and direct labor are still traced directly; only overhead allocation method changes

ABC vs. traditional allocation impact

  • Traditional (single volume-based rate, e.g., direct labor hours) can significantly under- or over-cost products compared to ABC
  • Total overhead allocated stays the same either way — only the distribution between products changes
  • This distortion correction (avoiding cross-subsidization between high/low-overhead products) is the core value of ABC

More from Activity-based costing (ABC)

  • ABC: system overview and key concepts
  • ABC: impact on inventory, COGS, and decision-making